Understanding Alanine Aminotransferase (ALT) Levels: Genetic Influences and Implications

Alanine Aminotransferase (ALT) Levels

Disclaimer: This article is for informational purposes only and is not intended to diagnose any conditions. LifeDNA does not provide diagnostic services for any conditions mentioned in this or any other article.

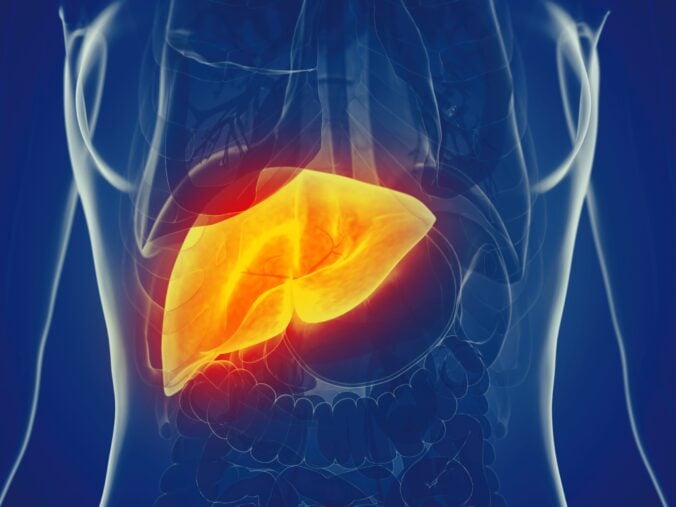
One key player in liver function is Alanine Aminotransferase (ALT), a crucial enzyme that helps break down proteins in order to produce energy from food. The levels of this enzyme in your body are influenced readily by your lifestyle choices, but your genetics can also have a role.

What is Alanine Aminotransferase (ALT)?

ALT is an enzyme predominantly found in the liver, though it is also present in smaller amounts in the kidneys, heart, muscles, and pancreas. 

It plays a critical role in amino acid metabolism, specifically in the transamination process where it helps convert alanine and α-ketoglutarate into pyruvate and glutamate. This conversion is essential for producing energy and synthesizing key biomolecules.

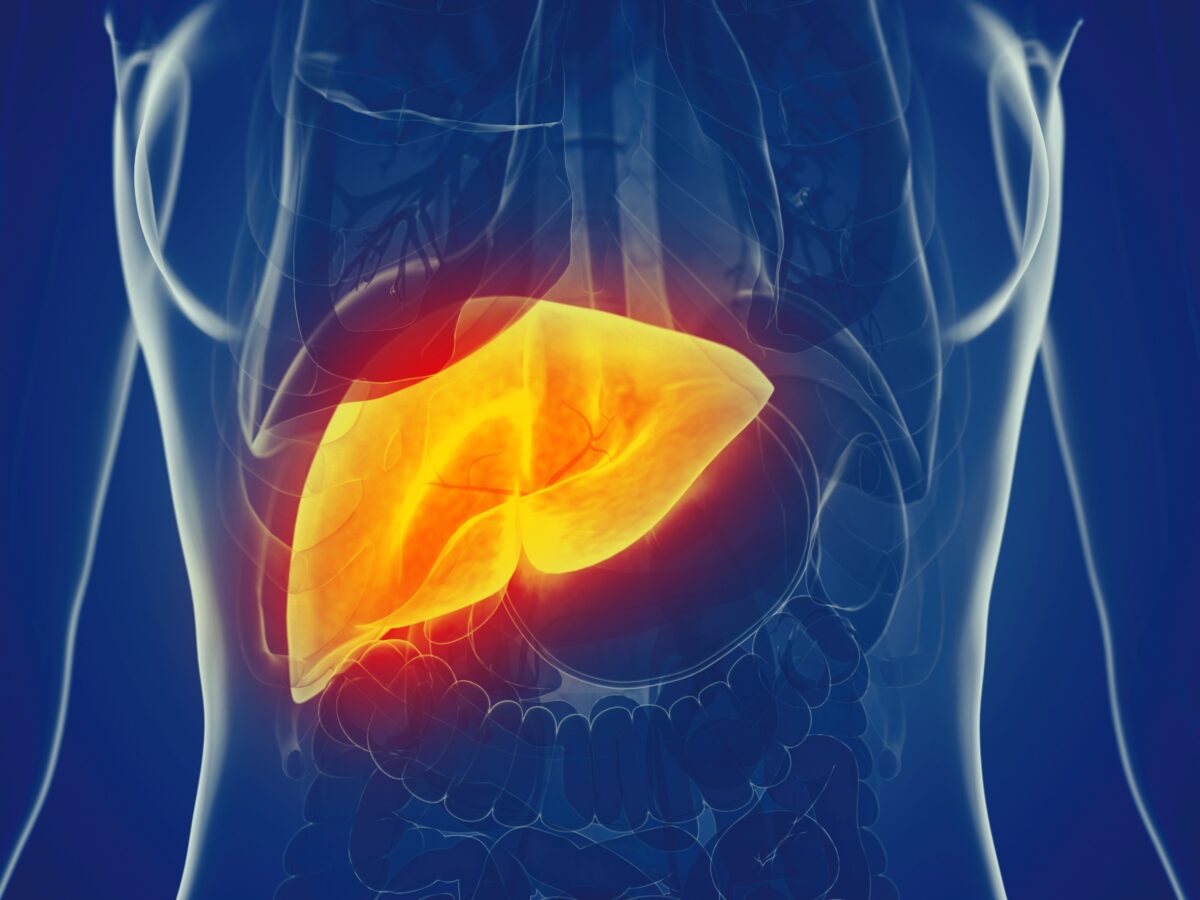
Alanine Aminotransferase (ALT) is one of the key markers used to assess liver function and detect potential liver damage. ALT levels in the blood are typically low, but when liver cells are damaged due to conditions such as hepatitis, cirrhosis, or liver inflammation, ALT is released into the bloodstream, causing levels to rise. 

Elevated ALT levels can indicate liver damage or disease, making it a vital marker in liver function tests. Understanding ALT and monitoring its levels can provide essential insights into liver health, enabling early detection and management of liver-related conditions.

Normal ALT Levels and What They Indicate

Monitoring liver health is crucial, and one of the simplest ways to do this is by measuring ALT levels in the blood. ALT levels are measured in units per liter (U/L) of blood, and normal ranges can vary slightly depending on the laboratory and population. Generally, normal ALT levels are considered to be between 7 and 56 U/L. These levels are indicative of healthy liver function, as ALT is an enzyme primarily found in liver cells.

When ALT levels fall within this normal range, it typically indicates that the liver is functioning properly without significant damage or inflammation. However, it is important to consider that normal ALT levels do not always guarantee the absence of liver disease, as some liver conditions may not elevate ALT levels significantly.

Elevated ALT levels, on the other hand, can indicate liver damage or disease. Conditions such as hepatitis, fatty liver disease, cirrhosis, and liver infections often lead to the release of ALT into the bloodstream, causing increased levels. Mild elevations may be seen with muscle injury or vigorous exercise, but significantly high ALT levels usually point to liver-specific issues. Regular monitoring of ALT levels, especially in individuals at risk for liver diseases, can help in the early detection and management of potential liver problems, promoting better overall health.

How to Test for ALT Levels

Detecting liver health issues early is crucial, and one straightforward method is through testing ALT levels in the blood. Testing for ALT levels can be part of a simple blood test known as a liver function test (LFT) or liver enzyme test. This test measures the concentration of ALT and other liver enzymes in the bloodstream, providing important information about liver health. Here’s a step-by-step overview of how this process works:

  1. Preparation: Typically, no special preparation is needed for a liver function test. However, patients may be advised to avoid certain medications or foods that could affect liver function and enzyme levels. It’s best to follow any specific instructions provided by the healthcare provider.
  2. Blood Sample Collection: A healthcare professional will draw a small amount of blood from a vein, usually from the arm. This procedure is quick and relatively painless, involving the insertion of a needle to collect the blood sample into a tube.
  3. Laboratory Analysis: The collected blood sample is sent to a laboratory for analysis. In the lab, the sample is processed using automated analyzers that measure the ALT and other enzyme levels. The results are typically reported in units per liter (U/L) of blood.
  4. Interpreting Results: Once the analysis is complete, the results are interpreted by healthcare professionals. Normal ALT levels range from 7 to 56 U/L. Results outside this range may indicate liver damage or disease and warrant further investigation or follow-up testing.

Regular monitoring of ALT levels, especially in individuals at risk for liver diseases, can provide valuable insights into liver health and help guide appropriate medical interventions.

Genetic Influences and Associations of ALT Levels

PNPLA3 Gene

PNPLA3, also known as ‘adiponutrin and Ca2+-independent phospholipase A2 epsilon’ (iPLA2ε), is a protein similar to adipose triglyceride lipase (AGTL), sharing a Ser–Asp catalytic dyad. This protein is found in white adipose tissue, the liver, and adrenal glands, and is located on lipid droplets as well as other parts of the cell. PNPLA3’s activity is influenced by nutritional, hormonal, and pharmacological factors, though in a manner opposite to ATGL.

The exact physiological substrate of PNPLA3 remains unknown. However, it has been shown to hydrolyze triglycerides in laboratory settings, suggesting it may also function as a lipase within the body. Interestingly, overexpression of active PNPLA3 does not significantly affect liver triglyceride levels. 

In contrast, the I148M variant of PNPLA3 is linked to fatty liver disease (steatosis) and a large increase in ALT levels in humans. Studies in mice have shown that removing PNPLA3 does not impact body composition, energy balance, liver lipid metabolism, glucose regulation, or insulin sensitivity. This suggests that the PNPLA3 I148M variant may act as a gain-of-function mutation, causing an increase in function that contributes to liver fat accumulation.

TM6SF2 Gene

A recent 2022 study has shown that the degree of triglyceride (TG) accumulation in the liver varies across different races. A genome-wide association study (GWAS) on this cohort identified two key genetic risk factors for the development of nonalcoholic fatty liver disease (NAFLD). The first is the patatin-like phospholipase domain-containing protein 3 (PNPLA3) gene, with the I148M variant (rs738409) being a predominant factor. 

The second significant genetic marker is a point mutation (rs58542926, c.499 C>T, P. Glu167Lys, E167K) in the transmembrane 6 superfamily 2 (TM6SF2) gene. This mutation is independently associated with elevated liver TGs, higher circulating levels of alanine aminotransferase (ALT), and lower levels of low-density lipoprotein cholesterol (LDL-C). Subsequent studies have confirmed the link between the TM6SF2 E167K variant and NAFLD.

The minor (T) allele of the E167K, a.k.a SNP rs58542926  is more frequent in East Asians (approximately 34%) and Europeans (approximately 26%), while it is less common in Hispanics/Latinos (approximately 10%) and Africans (6%). Interestingly, the literature also indicates that a greater proportion of lean patients with NAFLD carry the TM6SF2 rs58542926 T-allele compared to obese or overweight NAFLD patients, highlighting its independent role in the disease’s development.

Are ALT and SGPT the Same?

Understanding the different names for liver enzymes can be confusing. Alanine Aminotransferase (ALT) and Serum Glutamate Pyruvate Transaminase (SGPT) are indeed the same enzyme. Both terms refer to the same enzyme that plays a crucial role in amino acid metabolism by catalyzing the conversion of alanine and α-ketoglutarate to pyruvate and glutamate. 

Historically, SGPT was the term commonly used in medical literature and laboratory tests to refer to this enzyme. Over time, the nomenclature shifted to ALT, which more accurately describes its function and chemical activity. Despite the name change, the enzyme’s role in assessing liver health remains the same.

In summary, ALT and SGPT are two names for the same enzyme, and both are crucial markers in liver function tests. Understanding this terminology can help clarify medical results and discussions regarding liver health.

Are High ALT Levels Dangerous?

Discovering elevated ALT levels can be concerning. What does this mean for your health? High levels of Alanine Aminotransferase (ALT) in the blood generally indicate liver damage or disease. ALT is an enzyme primarily found in liver cells. When liver cells are damaged, ALT leaks into the bloodstream, resulting in elevated levels.

Several conditions can cause high ALT levels. These include acute and chronic hepatitis, non-alcoholic fatty liver disease (NAFLD), alcohol-related liver disease, cirrhosis, and liver tumors. Viral infections, such as hepatitis B and C, are also common causes of elevated ALT. Additionally, medications that are toxic to the liver, such as acetaminophen overdose, can also lead to increased ALT levels.

While mildly elevated ALT levels might not be immediately dangerous, persistently high levels warrant further investigation to identify the underlying cause. Without proper management, conditions causing elevated ALT can progress to more severe liver damage, including liver failure. Symptoms of significant liver issues include jaundice, abdominal pain, swelling, and confusion.

Early detection and treatment are crucial. If high ALT levels are identified, a healthcare provider may recommend additional tests, lifestyle changes, or medications to address the underlying condition and prevent further liver damage. Monitoring ALT levels regularly can help manage liver health effectively.

You may also like: Genetic Insights into Non-alcoholic Fatty Liver Disease

What are the Symptoms of High ALT Levels?

Elevated ALT levels can signal underlying liver issues. Recognizing the symptoms associated with high ALT can help in early diagnosis and treatment.

High ALT levels often indicate liver damage, but the abundance of the enzyme itself does not cause symptoms. Instead, symptoms arise from the underlying conditions causing the elevated ALT. Here are some common symptoms associated with high ALT levels:

  • Fatigue: One of the most prevalent symptoms, chronic fatigue, can result from impaired liver function and the body’s struggle to process toxins effectively.
  • Abdominal Pain and Swelling: Pain or discomfort in the upper right side of the abdomen can indicate liver inflammation or enlargement. Swelling (ascites) may also occur due to fluid accumulation.
  • Jaundice: This condition, characterized by yellowing of the skin and eyes, results from high bilirubin levels in the blood due to impaired liver function.
  • Dark Urine: When the liver is not functioning properly, bilirubin can cause the urine to appear dark.
  • Pale Stools: Impaired bile production or flow can result in pale or clay-colored stools, indicating liver or bile duct problems.
  • Nausea and Vomiting: Liver issues can disrupt digestion, leading to frequent nausea and vomiting.
  • Loss of Appetite: Reduced liver function can affect appetite and lead to unintentional weight loss.
  • Bruising and Bleeding Easily: The liver produces proteins essential for blood clotting. Liver damage can result in a reduced ability to clot blood, leading to easy bruising and bleeding.
  • Itchy Skin: Accumulation of bile salts in the skin due to liver dysfunction can cause intense itching.
  • Swollen Legs and Ankles: Poor liver function can lead to fluid retention in the legs and ankles (edema).

These symptoms can vary in severity and may develop gradually. If high ALT levels are detected alongside these symptoms, it’s essential to seek medical evaluation to determine the underlying cause and initiate appropriate treatment. Early intervention can help manage liver health and prevent further complications.

Lifestyle Modifications to Manage ALT Levels

Maintaining healthy ALT levels is crucial for liver health. Here are some effective lifestyle changes to help manage ALT levels.

Maintain a Healthy Diet

A balanced diet rich in fruits, vegetables, whole grains, lean proteins, and healthy fats supports liver function and can help manage ALT levels. Avoiding processed foods, excessive sugar, and saturated fats can reduce liver strain.

Stay Hydrated

Adequate hydration supports overall health, including liver function. Drinking plenty of water helps flush toxins from the body, potentially reducing ALT levels.

Exercise Regularly

Engaging in regular physical activity can help reduce fatty liver disease and improve liver health. Aim for at least 150 minutes of moderate-intensity exercise per week, such as brisk walking, swimming, or cycling.

Limit Alcohol Consumption

Alcohol is a significant contributor to liver damage. Reducing or eliminating alcohol intake can significantly lower ALT levels. For those who consume alcohol, moderation is key—generally, up to one drink per day for women and up to two drinks per day for men.

Avoid Tobacco and Recreational Drugs

Smoking and using recreational drugs can harm the liver. Quitting smoking and avoiding drug use can help maintain healthy ALT levels and overall liver function.

Manage Weight

Obesity is a major risk factor for liver disease. Maintaining a healthy weight through diet and exercise can help manage and reduce ALT levels. Weight loss, even as little as 5-10% of body weight, can improve liver enzyme levels.

Monitor Medications

Certain medications can affect liver function and ALT levels. Always follow prescribed dosages and discuss any over-the-counter drugs or supplements with a healthcare provider. Avoiding unnecessary medications can reduce liver strain.

Reduce Stress

Chronic stress can negatively impact liver health. Incorporating stress-reducing practices such as yoga, meditation, deep breathing exercises, and mindfulness can support overall well-being and liver function.

Get Regular Health Check-ups

Regular medical check-ups can help monitor liver health and ALT levels. Early detection of liver issues allows for timely intervention and management.

Avoid Exposure to Toxins

Minimize exposure to environmental toxins such as pesticides, chemicals, and pollutants that can affect liver health. Using protective equipment and ensuring proper ventilation when handling toxic substances can help protect the liver.

Eat Foods Rich in Antioxidants

Foods high in antioxidants, such as berries, nuts, and green leafy vegetables, can help protect the liver from oxidative stress and inflammation. Antioxidants support the liver’s detoxification processes.

Consider Liver-Friendly Supplements

Certain supplements may support liver health, such as milk thistle, turmeric, and omega-3 fatty acids. However, it is essential to consult with a healthcare provider before starting any supplements to ensure they are safe and appropriate for individual health needs.

Consume Moderate Amounts of Coffee

Some studies suggest that moderate coffee consumption may have protective effects on the liver and help lower ALT levels. Aim for 2-3 cups of coffee per day, but avoid adding excessive sugar or cream.

By adopting these lifestyle modifications, individuals can effectively manage their ALT levels, support liver health, and reduce the risk of liver-related diseases. Making these changes not only benefits liver function but also contributes to overall well-being and longevity.

LifeDNA’s Wellness Report

Unlock the secrets of your genetic blueprint with LifeDNA’s Wellness Report, a scientifically backed and comprehensive analysis designed to help you understand your body’s unique needs. This invaluable resource delves into how your genetics influence your daily habits, lifestyle, and predispositions, offering personalized insights to guide you on your wellness journey.

LifeDNA’s DNA Trait Reports feature seven main categories, including over 200 individual trait reports. Additional main reports are the Nutrition Report, Sleep Report, Vitamins and Supplements Report, Fitness Report, Personality and Cognition Report, and Skincare Report, which ensure you receive a holistic view of your genetic profile. Additionally, premium reports such as the Age-Related Report, Methylation Genes Report, and Detoxification Genes Report, provide deeper insights into specific health aspects.

Imagine tailoring your wellness plan based on your genetic predispositions. Whether optimizing your nutrition, enhancing your fitness routine, or understanding your sleep patterns, LifeDNA’s Reports offer the clarity you need to make informed decisions. 


Ready to start your wellness journey? Avail of LifeDNA’s plans today and empower yourself with the knowledge to live your healthiest life. Don’t just follow generic advice—discover what truly works for you based on your unique genetic makeup. Start understanding your body better with LifeDNA’s Wellness Report and take the first step towards a more personalized and effective approach to health and wellness.

References

  1. https://emedicine.medscape.com/article/2087247-overview?form=fpf
  2. https://www.webmd.com/digestive-disorders/alanine-aminotransferase-test
  3. https://www.healthline.com/health/alt#results
  4. https://www.sciencedirect.com/topics/medicine-and-dentistry/pnpla3
  5. https://www.yashodahospitals.com/diagnostics/sgpt-test/
  6. https://www.healthline.com/health/how-to-lower-alt
  7. https://my.clevelandclinic.org/health/symptoms/17679-elevated-liver-enzymes
How Genetics Shape Spatial Attention: A Deep Dive into Cognitive Abilities

How Genetics Shape Spatial Attention

Disclaimer: This article is for informational purposes only and is not intended to diagnose any conditions. LifeDNA does not provide diagnostic services for any conditions mentioned in this or any other article.

Spatial attention is the brain’s way of helping us focus on what matters in our surroundings. Whether it’s finding a familiar face in a crowded room or navigating through busy streets, spatial attention directs our focus to the right places at the right time. But have you ever wondered why some people seem naturally better at this than others? 

What is Spatial Attention?

Spatial attention is a cognitive process that allows the brain to focus on specific locations or objects in the environment while filtering out irrelevant information. It is crucial for everyday tasks, such as driving, reading, or even recognizing familiar faces in a crowd. By directing mental resources to a particular space or object, spatial attention enhances an individual’s ability to process visual, auditory, and tactile stimuli efficiently.

This ability is linked to specific brain regions, particularly the parietal lobe, which helps coordinate how the brain processes space and attention. Studies using neuroimaging techniques, like fMRI, show that different brain areas activate when individuals engage in tasks requiring spatial focus.

Genetic factors also contribute to how spatial attention functions. Research indicates that certain genetic variations influence neurotransmitter systems, such as dopamine and acetylcholine, which play a critical role in attention and cognitive control. These genetic predispositions may explain why some people are naturally more adept at tasks requiring spatial awareness, while others might struggle.

Understanding the genetic basis of spatial attention may elucidate how people interact with their surroundings and how their genetic makeup could influence their cognitive habits and day-to-day experiences.

How Does Spatial Attention Work?

Spatial attention works by allowing the brain to prioritize certain areas or objects in the environment, filtering out distractions to focus on what is most relevant. This process is essential for tasks that require visual or sensory attention, such as identifying a stop sign while driving or locating a book on a crowded shelf.

The brain achieves this by activating certain regions, particularly the parietal lobe and the frontal eye fields, which are involved in processing spatial information. These areas help direct attention to specific locations or stimuli, whether it’s something seen, heard, or felt. 

Spatial attention can be divided into two types: voluntary and reflexive. Voluntary attention is when someone consciously chooses to focus on something, like reading a page in a book. Reflexive attention happens automatically, such as when something suddenly catches the eye, like a flashing light.

Genetics also influences how spatial attention works. Certain variants in genes related to neurotransmitter activity can affect how well a person focuses on spatial tasks, highlighting the role of genetic predisposition in shaping everyday cognitive habits and behaviors.

What Other Factors Can Affect Spatial Attention? 

While genetics play a significant role in shaping spatial attention, various other factors can also influence how effectively a person can focus on and process spatial information. These factors range from environmental influences to neurological conditions and lifestyle choices. Here are some key contributors:

Age

As people age, their cognitive abilities, including spatial attention, can decline. Research shows that older adults may experience slower processing speeds and reduced attentional capacity. The brain’s ability to filter out distractions and focus on relevant stimuli may weaken over time, affecting tasks like driving or navigating new environments. This decline is thought to be linked to changes in brain structure and neurotransmitter function as the brain ages.

Brain Injuries

Injury to specific brain regions, such as the parietal lobe, can lead to deficits in spatial attention. Conditions like traumatic brain injury (TBI) or strokes can damage the neural pathways responsible for processing spatial information. For example, individuals with damage to the right parietal lobe often experience spatial neglect, where they fail to attend to stimuli on one side of their environment.

Neurological Disorders

Certain neurological disorders can impact spatial attention. Attention-deficit/hyperactivity disorder (ADHD) is one such condition, where individuals may struggle to maintain focus, especially on spatial tasks. Similarly, disorders like Alzheimer’s disease, Parkinson’s disease, and schizophrenia can affect how the brain processes spatial information, leading to attentional deficits.

Stress and Fatigue

High levels of stress and fatigue can impair spatial attention. When the brain is under stress, it may prioritize perceived threats, making it harder to focus on less urgent stimuli. Fatigue also reduces cognitive performance, including staying alert and focused on spatial tasks. Studies have shown that sleep deprivation, in particular, negatively affects spatial attention and increases reaction times during tasks requiring focus.

Training and Experience

Spatial attention can be improved with practice and training. Research studies on athletes, for example, have shown that individuals engaged in sports requiring strong spatial awareness, such as basketball or soccer, often exhibit heightened spatial attention skills. Similarly, professions requiring frequent navigation or spatial tasks, like pilots or surgeons, tend to sharpen these cognitive abilities over time.

Environmental Stimulation

The environment in which a person lives can also influence spatial attention. Constant exposure to highly stimulating environments, such as bustling urban areas, may enhance spatial awareness by requiring individuals to constantly navigate and process information. On the other hand, living in a more isolated or less stimulating setting could potentially reduce the brain’s need to focus on spatial cues, affecting attention.

Nutrition

Certain nutrients play a role in cognitive health and attention. For example, omega-3 fatty acids, found in fish oil, have been shown to support brain function, including attention. Similarly, deficiencies in vitamins like B12 and folate can negatively impact cognitive abilities, potentially affecting spatial attention.

Physical Exercise

Physical activity, particularly aerobic exercise, has been linked to improvements in attention, including spatial attention. Exercise increases blood flow to the brain and supports neuroplasticity, the brain’s ability to form new neural connections. This can enhance cognitive functions like attention and focus.

While genetics is a crucial factor in determining spatial attention, other variables such as age, brain health, lifestyle choices, and environmental factors also play significant roles in shaping how individuals navigate and focus on the world around them. Understanding these influences can help people make informed choices to optimize their cognitive abilities.

What is an Example of Spatial Attention?

A practical example of spatial attention is when someone is driving a car and focuses on navigating through a busy intersection. In this scenario, spatial attention helps the driver concentrate on relevant information, such as traffic signals, road signs, and other vehicles, while ignoring irrelevant stimuli like pedestrians on the sidewalk or billboards.

During this task, the brain’s parietal lobe and frontal eye fields are actively engaged. These regions coordinate to prioritize visual information, allowing the driver to maintain focus on the critical aspects of the environment. The brain filters out distractions and enhances the processing of stimuli that are essential for safe driving, such as the position and movement of other vehicles.

Spatial attention is crucial for efficiently directing cognitive resources to areas where they are most needed, ensuring that the driver can respond quickly to changing conditions. This ability is influenced by various factors, including genetics, which can affect how well someone can maintain focus and process spatial information.

Is Spatial Attention the Same as Visual Perception?

Spatial attention and visual perception are related but distinct cognitive processes. Spatial attention refers to the brain’s ability to focus on specific locations or objects in the environment while ignoring others. It involves directing cognitive resources to particular spatial areas, which helps prioritize and process information efficiently. For instance, when searching for a friend in a crowded room, spatial attention enables an individual to focus on specific areas of the room, enhancing the likelihood of finding the friend amid the crowd.

Visual perception involves the interpretation and understanding of visual stimuli received from the eyes. It encompasses processes such as detecting colors, shapes, and motion and integrating this information to form a coherent visual representation of the surroundings. Visual perception is essential for recognizing objects, assessing their size and distance, and understanding their relationships within a visual scene.

While spatial attention can enhance visual perception by focusing on relevant information, they operate through different mechanisms. Spatial attention involves neural networks in the parietal lobe and frontal eye fields, which prioritize and filter visual input. Visual perception primarily involves the occipital lobe, where initial processing of visual information occurs.

Spatial attention helps manage where cognitive focus is directed, improving the efficiency of visual perception. While they are interrelated—spatial attention can enhance how well visual information is perceived—they are distinct processes with different roles in interpreting and interacting with the environment. Understanding these processes can shed light on how genetics might influence cognitive functions related to visual tasks and spatial awareness.

What is the Difference Between Spatial Attention and Object Attention?

The brain regions involved in spatial attention include the parietal lobe and frontal eye fields, which work to direct cognitive resources to specific spatial areas. Object Attention, on the other hand, refers to focusing on specific objects or features within a visual scene, regardless of their location. 

This process allows individuals to selectively enhance the processing of particular objects, such as identifying a red car among many vehicles or distinguishing between different types of fruit on a table. Object attention is primarily mediated by the ventral visual pathway, including areas like the occipital and temporal lobes, which are responsible for recognizing and categorizing objects.

While both types of attention help manage visual information, they target different aspects. Spatial attention deals with where to focus, enhancing overall awareness of spatial locations, while object attention deals with what to focus on, improving the ability to recognize and evaluate individual objects. 

These processes often work together to help individuals effectively interpret and respond to their environment. Understanding the distinction between them can reveal how genetics and other factors influence cognitive functions related to visual and spatial tasks.

Is Bad Spatial Attention Dangerous?

Poor spatial attention can indeed pose risks and have significant impacts on daily life. Spatial attention is crucial for effectively navigating and interacting with the environment. When spatial attention is compromised, individuals may struggle to focus on important details or locations, leading to various practical challenges.

For example, deficits in spatial attention can impair one’s ability to safely operate a vehicle. Research has shown that reduced spatial attention increases the risk of accidents because individuals may fail to notice important traffic signals or obstacles. This impairment can also affect everyday activities, such as reading, where difficulty focusing on specific lines or words can hinder comprehension.

Moreover, poor spatial attention is associated with certain neurological and psychological conditions. Individuals with attention-deficit/hyperactivity disorder (ADHD) or stroke-related spatial neglect often experience difficulties in maintaining focus on spatial tasks, which can impact overall quality of life and independence.

Understanding how genetics and other factors influence spatial attention is crucial for managing and mitigating these risks. Genetic variations, along with lifestyle factors like stress and sleep, can affect spatial attention abilities. Addressing these influences through targeted interventions or lifestyle adjustments can help improve spatial attention and reduce potential dangers associated with its deficits.

Ways to Improve Spatial Attention 

Improving spatial attention can enhance everyday functioning and overall quality of life. Here are several methods to boost spatial attention:

Engage in Regular Physical Exercise

Physical activity has been shown to improve cognitive functions, including spatial attention. Aerobic exercises, such as running or cycling, increase blood flow to the brain and promote neuroplasticity, which can enhance attentional control. Studies suggest that regular exercise, particularly activities that involve complex movements and coordination, can lead to better spatial awareness and attentional capacity.

Practice Mindfulness and Meditation

Mindfulness and meditation techniques can improve spatial attention by training individuals to focus their mental resources more effectively. Research indicates that mindfulness practices enhance the ability to maintain attention and filter out distractions. Techniques such as focused breathing or body scans can help individuals become more aware of their spatial environment and improve their attentional skills.

Engage in Cognitive Training

Cognitive training exercises specifically designed to improve spatial attention can be beneficial. Games and tasks that require spatial reasoning, such as puzzles, mazes, or video games, can help strengthen attentional networks in the brain. Studies have demonstrated that regular practice with these types of tasks can lead to improvements in spatial attention and related cognitive functions.

Maintain a Healthy Diet

Nutrition plays a role in cognitive health and attentional capacity. Diets rich in omega-3 fatty acids, found in fish and nuts, have been linked to better cognitive function, including spatial attention. Antioxidants from fruits and vegetables also support brain health by reducing oxidative stress, which can positively impact attentional processes.

Get Adequate Sleep

Adequate and quality sleep is crucial for cognitive functions, including spatial attention. Sleep deprivation impairs attentional control and increases susceptibility to distractions. Studies show that proper sleep hygiene—such as maintaining a regular sleep schedule and creating a restful sleep environment—can enhance attentional abilities and overall cognitive performance.

Reduce Stress Levels

Chronic stress can negatively affect spatial attention by impairing cognitive functions and increasing distractions. Techniques for managing stress, such as relaxation exercises, deep breathing, and time management strategies, can help maintain attentional focus. Reducing stress through lifestyle adjustments can improve spatial attention and overall cognitive health.

Practice Visual and Spatial Skills

Engaging in activities that specifically target visual and spatial skills can help improve spatial attention. Activities like map reading, navigation exercises, and spatial reasoning games train the brain to process and focus on spatial information more effectively. Regular practice with these skills can lead to better spatial attention over time.

Monitor and Manage Health Conditions

Certain health conditions, such as ADHD or neurological disorders, can impact spatial attention. Managing these conditions through medical treatment and behavioral interventions can improve attentional abilities. For individuals with specific conditions, working with healthcare professionals to address underlying issues can enhance spatial attention and overall cognitive function.

Incorporating these strategies into daily life can help individuals improve their spatial attention, making it easier to navigate their environment and perform everyday tasks effectively. Understanding how various factors influence spatial attention, including genetics and lifestyle choices, allows for a more targeted approach to enhancing cognitive abilities.

Summary

  • Spatial attention helps people focus on important details in their surroundings, like finding a familiar face in a crowded room.
  • It is a cognitive process that allows the brain to filter out irrelevant information and concentrate on specific objects or locations.
  • Spatial attention is linked to brain regions like the parietal lobe, which coordinates how the brain processes space and attention.
  • Genetics plays a role in how spatial attention works, with certain genetic variations influencing neurotransmitter systems like those of dopamine and acetylcholine.
  • These genetic predispositions may explain why some people are naturally better at tasks requiring spatial awareness.
  • Spatial attention helps people stay aware of their environment, making it easier to process visual, auditory, and tactile stimuli efficiently.
  • Differences in spatial attention abilities, influenced by genetics, can affect how people interact with their surroundings, from driving to recognizing faces.
  • Studies using neuroimaging techniques show that different brain areas activate during spatial tasks, highlighting the importance of these regions in focusing attention.
  • Understanding the genetic basis of spatial attention elucidates how individual genetic makeup influences everyday cognitive habits, attentional control, and behaviors.

You may also like: Demystifying the Genetics of Sensitivity to Stimuli

References

  1. https://www.sciencedirect.com/topics/engineering/spatial-attention
  2. https://www.ncbi.nlm.nih.gov/pmc/articles/PMC6170011/
  3. https://my.clevelandclinic.org/health/articles/22581-dopamine
  4. https://my.clevelandclinic.org/health/articles/24568-acetylcholine-ach
  5. https://my.clevelandclinic.org/health/body/24628-parietal-lobe
  6. https://iastate.pressbooks.pub/individualfamilydevelopment/chapter/introduction-to-cognitive-development-in-late-adulthood/#:~:text=The%20processing%20speed%20theory%2C%20proposed,working%20memory%20becomes%20less%20efficient.
  7. https://www.ninds.nih.gov/health-information/disorders/traumatic-brain-injury-tbi
  8. https://www.psychiatry.org/patients-families/adhd/what-is-adhd#:~:text=Attention%2Ddeficit%2Fhyperactivity%20disorder%20(ADHD)%20is%20one%20of,in%20the%20moment%20without%20thought).
  9. https://www.cdc.gov/aging/aginginfo/alzheimers.htm#:~:text=Alzheimer’s%20disease%20is%20the%20most,thought%2C%20memory%2C%20and%20language.
  10. https://www.mayoclinic.org/diseases-conditions/parkinsons-disease/symptoms-causes/syc-20376055
  11. https://www.ncbi.nlm.nih.gov/pmc/articles/PMC7674527/
  12. https://www.ncbi.nlm.nih.gov/pmc/articles/PMC5444361/
  13. https://www.sciencedirect.com/science/article/abs/pii/S0272494421000827
  14. https://www.verywellmind.com/best-sources-of-fish-oil-1067008#:~:text=and%20fortified%20foods.-,Mental%20Health%20Benefits%20of%20Fish%20Oil,impact%20brain%20health%20throughout%20life.
  15. https://www.ncbi.nlm.nih.gov/pmc/articles/PMC5903566/
  16. https://www.sciencedirect.com/topics/psychology/visual-perception
  17. https://www.sciencedirect.com/topics/veterinary-science-and-veterinary-medicine/object-based-attention
  18. https://www.ncbi.nlm.nih.gov/pmc/articles/PMC3448564/
  19. https://www.healthline.com/health/spatial-awareness
  20. https://www.apa.org/monitor/2012/07-08/ce-corner#:~:text=Researchers%20theorize%20that%20mindfulness%20meditation,to%20effective%20emotion%2Dregulation%20strategies.
  21. https://www.medicalnewstoday.com/articles/brain-exercises
  22. https://www.ncbi.nlm.nih.gov/pmc/articles/PMC7674527/
  23. https://www.hopkinsmedicine.org/health/conditions-and-diseases/neurological-disorders 

Can Your Genes Predict Your Ice Cream Flavor Preference?

Disclaimer: This article is for informational purposes only and is not intended to diagnose any conditions. LifeDNA does not provide diagnostic services for any conditions mentioned in this or any other article.

When people indulge in their favorite ice cream, they might not consider the genetic factors behind their flavor preferences. Some reach for a scoop of chocolate, while others gravitate toward fruity sorbets or nutty concoctions. But is this purely a matter of personal taste or could their genetics be guiding their choices? The science behind taste is complex and involves multiple factors that shape individual preferences. 

How Do People Experience Flavor?

The human experience of flavor involves a sophisticated interplay between taste, smell, and texture. While taste buds detect five primary tastes—sweet, salty, bitter, sour, and umami—our perception of flavor goes beyond this. 

Taste buds are located on the tongue and contain specialized receptors that interact with molecules in food. However, the experience of eating ice cream is also influenced by smell, detected by olfactory receptors in the nose, and texture, which provides the creamy or crunchy sensations that complete the eating experience.

Research has shown that genetics can influence how taste buds detect certain flavors, particularly sweet and bitter tastes. Some people are more sensitive to bitterness, while others may have a heightened sense of sweetness. This sensory input is processed in the brain, where it is combined with memories, emotions, and personal experiences to create a subjective interpretation of flavor.

What are the Usual Ice Cream Flavor Preferences?

Ice cream flavor preferences can vary widely, but some flavors consistently emerge as favorites. A study by the International Dairy Foods Association (IDFA) identified the most popular ice cream flavors in the United States:

  1. Vanilla
  2. Chocolate
  3. Strawberry

Other frequently chosen flavors include:

  • Cookies and cream
  • Mint chocolate chip
  • Butter Pecan

However, these preferences aren’t universal. Cultural differences and regional availability influence flavor choices around the world. For instance, in Japan, green tea ice cream is a common favorite, while dulce de leche flavor is highly popular in parts of Latin America.

Although environmental factors, such as exposure to certain flavor profiles, play a significant role in shaping preferences, genetics may also contribute. Individual sensitivity to sweetness, bitterness, and creaminess — factors influenced by genes — can steer people toward specific flavors. This means that while culture and environment help shape what people enjoy, genetic predispositions may guide their choices on a more fundamental level.

Is Preferring Ice Cream Related to Age?

Age has a well-documented impact on taste preferences, and this extends to ice cream flavors. In childhood, the palate tends to favor sweet and creamy flavors, which is why children often choose flavors like chocolate and cookie dough. As people age, their taste buds undergo changes that affect how they perceive flavor. Older adults may find themselves preferring less sweet and more complex flavors, such as coffee or pistachio.

This shift in preference can be partially explained by the reduction in the number of taste buds that occurs with age. Additionally, changes in olfactory function may make certain flavors less appealing. Sweetness is often perceived as less intense in older adults, which might explain the increased preference for stronger, more savory, or bitter flavors.

Is Ice Cream Flavor Preference Inherited?

While environment, culture, and personal experiences undoubtedly shape flavor preferences, emerging research suggests that genetics also play a significant role. The concept of genetic predisposition to taste preferences revolves around variations in taste receptor genes. These genetic variations can determine how sensitive an individual is to certain tastes, which can influence their food and flavor choices.

For instance, the TAS1R and TAS2R gene families are responsible for encoding sweet and bitter taste receptors, respectively. Variants of these genes can make individuals and their family members more or less sensitive to sweet or bitter flavors. Someone with a heightened sensitivity to bitterness may avoid flavors like dark chocolate or coffee-flavored ice cream, while someone with a genetic preference for sweetness may seek out ice creams rich in sugar or honey.

Genes Linked to Sweet and Bitter Taste Preferences

The TAS1R gene family, which includes TAS1R2 and TAS1R3, is responsible for sweet taste perception. People with certain variants of these genes may be more likely to enjoy sweeter foods and desserts, including sweet ice cream flavors.

A study found that people with certain variants of the TAS2R38 gene, which is linked to bitter taste perception, are more likely to dislike bitter foods like broccoli, coffee, and dark chocolate. This same gene could also affect their preference for certain ice cream flavors, particularly those that include bitter elements like cacao or coffee.

Interestingly, the preference for sweet or bitter tastes may also be influenced by evolutionary biology. Sweet flavors typically signal calorie-dense, energy-rich foods, while bitterness can indicate potentially toxic substances. This may explain why a genetic preference for sweet flavors has persisted across human populations, while bitterness sensitivity varies widely among individuals.

Can You Change Your Ice Cream Preferences Over Time?

While genetics certainly play a role in shaping taste preferences, these preferences are not set in stone. Taste is a dynamic sense, and factors such as age, environment, and exposure can alter one’s flavor preferences over time. For example, repeated exposure to certain flavors can lead to an increased liking for them—a phenomenon known as taste adaptation.

This process occurs because taste receptors can become less sensitive to a flavor after repeated exposure, allowing individuals to tolerate or even enjoy flavors they initially disliked. This is particularly true for bitter flavors, which many people learn to enjoy as they grow older. Flavors that may have been too intense or unappealing during childhood, such as coffee or dark chocolate, can become favorites in adulthood.

Dietary habits and lifestyle choices can also influence taste preferences. A diet high in sugary foods may increase a preference for sweet flavors while reducing sugar intake could shift preferences toward less sweet or more complex flavors. Additionally, hormonal changes, medications, and health conditions can impact how flavors are perceived, further modifying preferences over time.

How Flavor Sensitivity Varies Between Individuals

Not everyone experiences flavor in the same way, and genetic differences in taste perception can lead to significant variations in flavor sensitivity. Some individuals, known as “supertasters,” have a heightened sensitivity to certain tastes, particularly bitterness. 

Supertasters have a higher density of taste buds and are more likely to find bitter flavors, such as those in coffee or dark chocolate, overpowering. This heightened sensitivity can influence their ice cream choices, steering them away from flavors with even a hint of bitterness.

On the other end of the spectrum, non-tasters have fewer taste buds and may have a reduced sensitivity to certain flavors. These individuals may prefer stronger, more intense flavors because they do not experience the same level of taste intensity as supertasters. Non-tasters may be more likely to enjoy bold, rich ice cream flavors, such as those with high cocoa content or complex mixtures of ingredients.

Other factors, such as the density of taste buds and overall sensory sensitivity, also play a role in determining an individual’s level of flavor sensitivity.

How Smell and Texture Affect Ice Cream Choices

Flavor and food preferences are influenced not only by taste but also by smell and texture. In fact, up to 80% of what people perceive as flavor comes from their sense of smell. This is why ice creams with aromatic ingredients, such as vanilla or mint, tend to have a more intense flavor profile compared to those with milder scents. 

Texture is another key factor in the enjoyment of ice cream. Some people prefer smooth, creamy textures, while others enjoy the crunch of added ingredients like nuts or cookies. The sensation of creaminess is detected by receptors in the mouth that respond to fat content and viscosity. These receptors are influenced by both genetics and experience, meaning some individuals may have a genetic predisposition to prefer certain textures. For example:

  • Smooth and creamy: Studies show that variations in the CD36 gene — which plays a role in fat perception — can affect how people experience the creaminess of high-fat foods like ice cream.
  • Crunchy and chunky: Those less sensitive to texture may enjoy ice cream with added crunch.

Ice cream flavor preferences are shaped by a combination of genetic, environmental, and personal factors. Genetics can influence sensitivity to sweetness, bitterness, smell, and texture, but preferences aren’t fixed. They can evolve due to exposure, age, and lifestyle changes.

As research continues to uncover how genetics influence flavor perception and preferences, it may one day be possible for individuals to tailor their ice cream choices based on their unique genetic profile, creating a more personalized and enjoyable flavor experience.

Summary

  • Ice cream flavor preferences vary among individuals and may be influenced by genetics.
  • Flavor perception involves taste, smell, and texture, with up to 80% of flavor coming from smell.
  • Taste buds detect five main flavors: sweet, salty, bitter, sour, and umami.
  • Genetics influence how taste buds detect flavors, particularly sweetness and bitterness.
  • Popular ice cream flavors in the U.S. include vanilla, chocolate, and strawberry.
  • Cultural differences impact flavor preferences globally, like green tea in Japan or dulce de leche in Latin America.
  • Age affects taste preferences; children prefer sweet flavors, while adults may enjoy more complex ones like coffee.
  • Genetic predisposition to taste is linked to variations in taste receptor genes, including TAS1R (sweet) and TAS2R (bitter). The TAS2R38 gene affects bitter taste perception, influencing preferences for flavors like dark chocolate or coffee.
  • Sweet and bitter taste preferences may be evolutionarily linked to survival (sweet for energy, bitter for toxins).
  • Preferences can change over time due to exposure, age, diet, and lifestyle choices.
  • Genetic differences lead to varying flavor sensitivity; “supertasters” are more sensitive to bitterness, while “non-tasters” prefer bold flavors.
  • Smell and texture also affect flavor preference, with variations in genes like CD36 influencing texture sensitivity.
  • Genetic, environmental, and personal factors shape ice cream preferences, which can evolve throughout life.

References

  1. https://psychcentral.com/lib/the-development-of-food-preferences#1
  2. https://newlywedsfoods.com/five-basic-tastes/
  3. https://ncbi.nlm.nih.gov/pmc/articles/PMC1698869/
  4. https://www.idfa.org/whats-hot-in-ice-cream
  5. https://www.limepack.eu/blog/ice-cream/decoding-the-ice-cream-target-market-tastes-and-trends-shaping-demand#:~:text=Young%20adults%20might%20gravitate%20towards,cream%20manufacturers%20need%20to%20address.
  6. https://journals.sagepub.com/doi/10.1177/02601060231186865#:~:text=The%20ability%20of%20humans%20to,enables%20the%20detection%20of%20bitterness.
  7. https://www.ncbi.nlm.nih.gov/pmc/articles/PMC8669025/
  8. https://www.sciencedirect.com/topics/agricultural-and-biological-sciences/tas1r1#:~:text=The%20TAS1R%20gene%20family%20encodes,combination%20of%20TAS1R1%20and%20TAS1R3.
  9. https://www.sciencedirect.com/science/article/abs/pii/S0950329318301204
  10. https://www.healthline.com/health/food-nutrition/supertaster#:~:text=Some%20people%20have%20more%20of,coffee%2C%20beer%2C%20and%20chocolate.
  11. https://nutritionsource.hsph.harvard.edu/2016/05/31/super-tasters-non-tasters-is-it-better-to-be-average/
  12. https://www.ncbi.nlm.nih.gov/books/NBK279408/#:~:text=It%20is%20not%20only%20the,taste%20is%20combined%20with%20smell.

The Role of Bilirubin in Your Health

Bilirubin in Your Health

Disclaimer: This article is for informational purposes only and is not intended to diagnose any conditions. LifeDNA does not provide diagnostic services for any conditions mentioned in this or any other article.

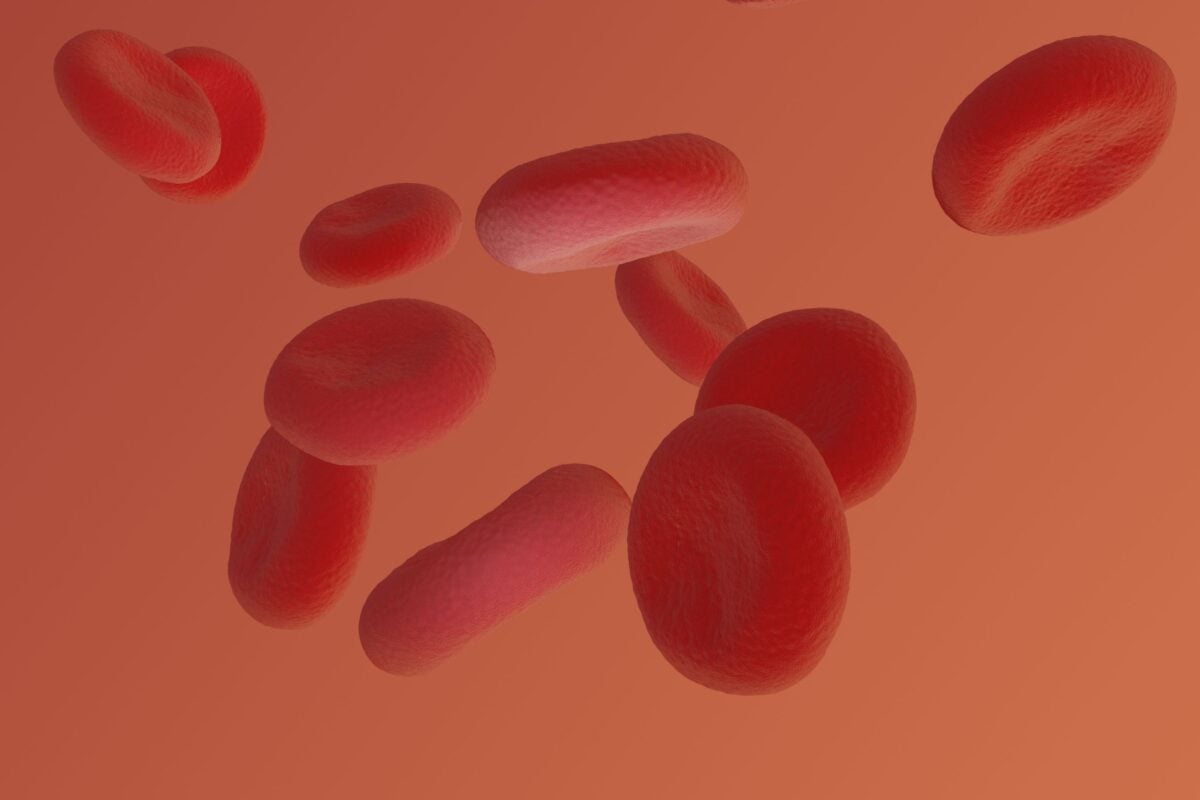
Bilirubin is a yellow substance produced when your body breaks down old red blood cells. This is a normal process that helps recycle iron and keep your cells healthy. Initially, bilirubin is in an unconjugated form, which means it’s not ready to be removed from the body. It then travels to the liver, where bilirubin is transformed into a form that’s easier for the body to get rid of. This process makes bilirubin conjugated and water-soluble, so it can be expelled through bile and eventually leave the body in stool. A healthy liver handles most of the bilirubin by releasing it into the bloodstream, where it’s carried to the intestines to be excreted.

Understanding bilirubin and regularly monitoring its levels is essential for evaluating liver function and overall health. By keeping track of bilirubin levels, healthcare providers may detect potential issues early on, making sure to take effective treatment. 

You may also like: Does Genetics Influence Liver Enzyme Levels?

What Does Bilirubin Level Indicate?

Bilirubin levels in the body provide important insights into overall health and may indicate various underlying health issues. Abnormal bilirubin levels may suggest different health problems, which can be grouped into causes and consequences:

Causes of High Bilirubin Levels:

  • Liver Function: Bilirubin is processed in the liver, where it becomes water-soluble and ready for excretion. If the liver is damaged or not functioning properly, bilirubin can accumulate in the blood, leading to elevated levels.
  • Hemolytic Anemia: Conditions like hemolytic anemia cause red blood cells to break down faster than normal, resulting in higher levels of unconjugated bilirubin in the blood.
  • Bile Duct Obstruction: Blockages in the bile ducts, such as gallstones or tumors, can prevent bilirubin from being excreted, leading to a buildup in the blood.
  • Hepatitis: Hepatitis, an inflammation of the liver often caused by a viral infection, hinders the liver’s ability to process bilirubin, resulting in higher blood levels.
  • Intrahepatic Cholestasis of Pregnancy: This condition, occurring during the last trimester of pregnancy, slows or stops bile drainage from the liver, impairing bilirubin processing and leading to increased bilirubin levels.

Consequences of High Bilirubin Levels:

  1. Jaundice: When bilirubin levels become too high, it can lead to jaundice, where the skin and eyes take on a yellowish hue. This condition can occur in both adults and newborns. In newborns, it may cause neonatal jaundice, which often resolves on its own but might require treatment if levels are very high.
  2. Gallstone Formation: Persistently high levels of bilirubin can contribute to the formation of gallstones, where substances like bilirubin or cholesterol harden in the gallbladder.

What is the Normal Range of Bilirubin?

In adults, typical bilirubin levels range from 0.2 to 1.2 milligrams per deciliter (mg/dL). Levels above 1.2 mg/dL are generally considered elevated and may indicate underlying health issues. For children between the ages of 15 days and 18 years, healthy bilirubin levels should be below 1.0 mg/dL.a=A nomogram can be used to assess the risk of hyperbilirubinemia (high bilirubin levels) in newborns based on their postnatal age in hours. For newborns, the interpretation of bilirubin levels depends on specific conditions and the rate of increase. For example, a bilirubin level of 8 mg/dL on the second day of life might not be alarming on its own. However, if the level was 3 mg/dL on the first day, a rapid increase to 9 mg/dL could signal the need for closer monitoring and possible intervention. 

Genetic Factors Influencing Bilirubin Levels

Bilirubin levels in the blood can significantly vary due to various factors, including genetics. Multiple studies (Telega, 2018; Grossman, 2011; Chowdhury, 2012) have identified a gene linked to Gilbert’s Syndrome (GS), which is inherited within families, and causes high blood bilirubin levels. Gilbert’s Syndrome is a common and harmless genetic condition that affects up to 8% of the population. It is inherited in an autosomal dominant manner, meaning that if one parent possesses the gene mutation, their children have a possibility of inheriting it as well. The condition is more frequently seen in boys than girls and typically appears in older children or teenagers.

GS is caused by a mutation in the UGT1A1 gene. This gene helps produce an enzyme needed to convert bilirubin, a substance made by the liver, into a form that can be easily removed from the body. In people with GS, this enzyme doesn’t work as well, leading to higher levels of bilirubin in the blood.

Despite the biochemical changes, around one-third of individuals with GS show no symptoms, and the condition is often discovered accidentally during blood tests conducted for other reasons. When symptoms do occur, they typically involve mild, persistent, or occasional yellowing of the skin and eyes (jaundice), especially during periods of stress, illness, fasting, or alcohol consumption.

Doctors diagnose GS by noting mild increases in bilirubin levels without signs of liver damage or red blood cell breakdown. Blood tests usually show normal liver function. The diagnosis can be confirmed if bilirubin levels increase significantly after a 24-hour fast. Genetic testing can also identify the specific UGT1A1 gene mutation responsible for the condition.

Interestingly, GS might have some health benefits. Research by Kundur et al. (2015) has shown that people with GS have higher levels of antioxidants in their blood, including bilirubin and glutathione. These antioxidants defend the body against damage caused by harmful molecules related to  oxidative stress.

The study suggests that individuals with GS have a decreased risk of heart disease and associated deaths. This protection might be due to elevated bilirubin reducing the activity of platelets, the small blood cells that form clots. Oxidative stress can enhance platelet activity, which raises the risk of blood clots and heart attacks. By acting as a natural anti-clotting agent, bilirubin may lower the risk of heart attacks and explain why people with GS have lower heart disease mortality.

Some FAQs on Bilirubin

What is a Bilirubin test?

A bilirubin test checks the amount of bilirubin in your blood to help doctors evaluate your liver performance. It is commonly included in a group of tests that assess liver health. Normally, a healthy liver processes and removes bilirubin efficiently. However, if you have liver problems, bilirubin can accumulate to unhealthy levels in your body, indicating potential liver disease.

Why do I need a bilirubin blood test?

Doctors frequently request a bilirubin blood test to diagnose and monitor different health conditions.

You might require this test if you have symptoms like yellowing of the skin or eyes, dark-colored urine, or stomach pain, as these could be signs of liver issues such as hepatitis, cirrhosis, or gallbladder problems.

The test can also help determine if there’s a blockage in the bile ducts. For individuals with existing liver diseases or disorders, a bilirubin test is essential for monitoring the condition and assessing liver function. In some cases, concerns related to the breakdown of red blood cells, such as in cases of hemolytic anemia, occur. 

Why do many newborns develop jaundice, and how is it treated?

Many newborns develop jaundice a few days after birth due to high bilirubin levels. This happens because newborns have more red blood cells that break down quickly, but their livers are not yet fully developed to process bilirubin efficiently. Before birth, the pregnant person’s liver helps manage bilirubin. A newborn’s liver is only about 1% as active as an adult’s liver.

In most newborns, jaundice appears within 1 to 3 days after birth, with bilirubin levels peaking around the fourth or fifth day. These levels can reach up to 18 mg/dL. Typically, the jaundice resolves within 2 weeks as the baby’s liver matures and becomes better at processing bilirubin.

To help reduce bilirubin levels, feeding the baby 8 to 12 times per day promotes regular bowel movements, which aids in removing bilirubin from the body. In most cases, this condition is temporary and clears up on its own. However, if jaundice persists or bilirubin levels become very high, medical treatments such as phototherapy, intravenous immunoglobulin, or exchange transfusion may be necessary.

What are the symptoms of high bilirubin?

The symptoms of high bilirubin can vary depending on the underlying cause. Some people with mildly elevated bilirubin levels may not experience any symptoms at all.

For those with moderately high bilirubin, the primary symptom is often jaundice, which is characterized by a yellowish color in the eyes and skin. Jaundice is the most common and noticeable sign of elevated bilirubin levels.

Other general symptoms that might accompany conditions causing high bilirubin include:

  • Abdominal pain or swelling: Liver or gallbladder disorders that increase bilirubin levels can cause abdominal pain or swelling due to inflammation, obstruction, or damage to these organs.
  • Chills: Chills can occur with infections or inflammation of the liver (like hepatitis), which can also raise bilirubin levels.
  • Fever: Fever may indicate an underlying infection or inflammatory condition affecting the liver, such as hepatitis or a bile duct infection, which can also lead to elevated bilirubin.
  • Chest pain: Though less directly related, severe liver disease or complications can cause chest pain, possibly due to referred pain or related cardiovascular stress.
  • Fatigue: High bilirubin can be a sign of liver dysfunction, leading to fatigue and weakness due to the liver’s role in energy metabolism.
  • Lightheadedness: Severe liver diseases causing high bilirubin can disrupt normal metabolic processes, leading to symptoms like lightheadedness due to reduced blood flow or oxygen levels.
  • Nausea: High bilirubin can result from liver or gallbladder disease, which can also cause digestive disturbances like nausea.
  • Unusually dark urine: High bilirubin levels in the blood can lead to its excretion in the urine, causing a darker color. This is particularly associated with direct (conjugated) bilirubin which is water-soluble.

Tips to Naturally Lower Bilirubin Levels

To naturally lower your bilirubin levels and support overall liver health, consider implementing the following lifestyle and dietary changes:

Eat a Balanced Diet: A diet rich in fruits, vegetables, and whole grains provides essential nutrients that support liver health. Vitamins, minerals, and antioxidants support liver function, which helps in a more efficient processing and elimination of bilirubin.

Stay Hydrated: Drink lots of water to maintain general liver health. It helps in the elimination of toxins from the body, including excess bilirubin. 

Fiber-Rich Food: Food items with high fiber like oats, beans, and whole grains may help with digestion. Improved digestion can help the body remove excess bilirubin through regular bowel movements.

Control Alcohol Consumption: Drinking too much alcohol may harm the liver’s ability to process and eliminate bilirubin. 

Refrain from Consuming Processed and High-Fat Foods: Consuming certain food itemsfood like these can increase the risk of liver inflammation and fatty liver disease. Avoiding fried foods, junk food, and processed snacks can help prevent liver damage and support healthy bilirubin levels.

Regular Exercise: Exercise regularly because it enhances blood circulation, helps to lose weight, and improves overall liver function. Physical activity reduces fat buildup in the liver and promotes better metabolic health, which can assist in lowering bilirubin levels.

Maintain a Healthy Weight: Maintain a healthy body weight to prevent liver problems. A healthy liver is more efficient at processing and eliminating bilirubin, which helps keep its levels in the normal range.

Avoid Excessive Use of Over-the-Counter Medications: Over-the-counter pain relievers, especially those containing acetaminophen, can strain the liver when used excessively. Managing medication use and consulting with a healthcare professional can help avoid liver complications.

Manage Stress: Chronic stress can impact liver function and overall health. Incorporate stress management techniques such as meditation, deep breathing exercises, and relaxation techniques to support liver health.

Limit Exposure to Toxins: Minimize exposure to environmental toxins and chemicals that can stress the liver. This includes avoiding cigarette smoke, limiting exposure to industrial chemicals, and using natural cleaning products.

References

  1. https://medlineplus.gov/lab-tests/bilirubin-blood-test/ 
  2. https://www.urmc.rochester.edu/encyclopedia/content.aspx?contenttypeid=167&contentid=total_bilirubin_blood 
  3. https://www.medicalnewstoday.com/articles/315086#in-newborns 
  4. https://www.bioma.me/bioma-health/biomarkers/the-role-of-bilirubin-in-the-body 
  5. https://www.healthline.com/health/high-bilirubin#bilirubin-levels 
  6. https://www.sciencedirect.com/topics/nursing-and-health-professions/gilbert-disease#:~:text=A%20presumptive%20diagnosis%20of%20Gilbert,postprandial%20bile%20acids%20are%20normal. 
  7. https://gracelaboratory.com/how-to-reduce-direct-bilirubin/
  8. https://www.sciencedirect.com/science/article/abs/pii/S0021915014016645

Genetic of Copper Metabolism: Understanding Wilson’s Disease

Genetic of Copper Metabolism

Why Is Copper Important For You?

Copper is an essential trace mineral needed for forming red blood cells, and maintaining healthy bones, blood vessels, nerves, and immune function. Copper is vital for several enzymes, including cytochrome c oxidase and superoxide dismutase. Cytochrome c oxidase helps in energy production at the cellular level, whereas superoxide dismutase is an antioxidant enzyme that helps protect cells from oxidative damage. Proper copper metabolism is essential for these functions to occur efficiently.

Copper is also involved in making and maintaining connective tissues. This contributes to the integrity of skin, blood vessels, and cartilage (a tissue that cushions your joints). Copper helps in the absorption of iron, thus preventing anemia, and supports brain health by participating in the synthesis of neurotransmitters. Although copper is vital for health, it is needed only in small amounts, and both deficiency and excess can lead to significant health issues. Balancing copper intake through diet which includes foods like shellfish, nuts, seeds, and whole grains, is essential for maintaining overall health. 

Despite a healthy balanced diet, if your blood report shows that you have too much copper in your system, then it is time to examine your genetics.

Genetics of Copper Metabolism 

The excess copper that may flow into your bloodstream is usually filtered out by the liver and excreted through bile. However, in some individuals, a genetic mutation impairs this process, leading to toxic levels of copper buildup. This accumulation can cause severe damage to the liver, central nervous system, and other organs, resulting in a variety of symptoms such as liver disease, neurological disorders (e.g. tremors, difficulty speaking), psychiatric disturbances, and so-called Kayser-Fleischer rings—brownish rings around the cornea of the eyes. This genetic disorder is called Wilson’s disease (WD).

Wilson’s disease is considered a rare genetic disorder, with an estimated prevalence of approximately 1 in 30,000 to 40,000 individuals worldwide. However, the carrier rate (those with one copy of the mutated gene) is higher, affecting about 1 in 90 people.

Kayser-Fleischer Rings

Kayser-Fleischer rings are copper deposits that form around the edge of the cornea in the eye, appearing as brownish or greenish rings. These rings are a vital diagnostic sign of Wilson’s disease, indicating excess copper accumulation in the body. They are typically detected through an eye examination using a slit lamp. They are most commonly associated with neurological symptoms in Wilson’s disease patients.

Hereditary Pattern of Wilson’s Disease

Wilson’s disease (WD) follows an autosomal recessive inheritance pattern, meaning an individual must inherit two copies of the mutated ATP7B gene—one from each parent (homozygous mutation)—to develop the disease. If both parents are carriers, there is a 25% chance that their child will have Wilson’s disease, a 50% chance that the child will be a carrier (with one mutated gene and one normal gene or having a heterozygous mutation), and a 25% chance that the child will inherit two normal genes. 

Individuals can also manifest WD as a compound heterozygote. A compound heterozygote is an individual who inherits two different mutant alleles of a gene, one from each parent, resulting in the genetic condition. Unlike a homozygote, with two identical mutant alleles, a compound heterozygote has two distinct mutations in the same gene. More on this below.

Carriers (heterozygous individuals) typically do not exhibit symptoms but can pass the mutated gene to their offspring. This pattern explains why Wilson’s disease can appear in families without any prior history of the condition. It makes Wilson’s disease a type of Mendelian disorder. 

ATP7B Gene

The ATP7B gene encodes a protein that helps transport excess copper from liver cells into bile for excretion. This process is vital for preventing copper accumulation in tissues, which can be toxic. Mutations in the ATP7B gene lead to impaired copper transport, causing copper to build up in the liver, brain, and other organs, which is the underlying cause of Wilson’s disease symptoms. This gene’s function is essential for maintaining copper homeostasis, and its mutations are associated with developing this potentially life-threatening disorder.

Research Updates

As explained earlier, many WD patients can manifest as compound heterozygotes. They have two different mutations in each allele inherited from each parent. The effects of these mixed mutations are not understood fully. 

In a 2020 study of five mutations found in Indian WD patients, researchers found that mutations in the regulatory domains (A595T, S1362A, and S1426I) reduced copper transport activity without affecting ATP7B’s targeting to the trans-Golgi network (part of the cell that helps distribute protein). This finding is crucial because it shows that while the ATP7B protein can still reach its proper location within the cell (the trans-Golgi network), the mutations in the regulatory domains impair its ability to transport copper effectively. The same study also showed that mutations in the ATP-binding domain (G1061E and G1101R) led to ATP7B retention in the endoplasmic reticulum and reduced protein levels. It indicates that mutations in the ATP-binding domain prevent the ATP7B protein from reaching its functional location and reduce the overall levels of the protein, leading to a more severe disruption in copper transport.

When two different mutations were co-expressed, mimicking the compound-heterozygous state, the interaction between these mutations altered ATP7B’s cellular behavior, emphasizing the importance of studying both homozygous and compound-heterozygous states to understand WD’s variable presentation better. This insight is crucial for developing targeted therapies that might restore copper transport without correcting the protein’s localization.

A 2022 study in the Pakistani population found significant clinical heterogeneity among patients, including reduced serum ceruloplasmin, chronic liver damage, and increased 24-hour urinary copper excretion. The average age of onset was 11.3 years, with 75% of patients displaying Kayser-Fleischer rings. Notably, 82.5% of the patients came from inbred families, and those with neurological symptoms were typically over 12 years old. The study identified ten variants in the ATP7B gene, including one previously reported pathogenic variant and four potentially novel synonymous variants, along with five known polymorphisms. This research enhances understanding of the clinical presentations and genotype-phenotype correlations in Pakistani WD cases, offering insights into ATP7B function and structure, which could aid in disease prognosis and family counseling.

How is Wilson’s Disease Treated?

Due to its rarity and the variability of its symptoms, Wilson’s disease is often underdiagnosed or misdiagnosed, particularly in its early stages when symptoms may mimic other more common conditions. Early detection and treatment are crucial for preventing irreversible damage.

Wilson’s disease treatment primarily focuses on reducing copper levels in the body and preventing further accumulation. The mainstay of treatment is chelation therapy, which involves medications like penicillamine or trientine that bind to copper and promote excretion through urine. 

Another approach is the use of zinc salts, which reduce the absorption of copper in the intestines. In cases of severe liver damage, a liver transplant may be necessary. Alongside medical treatment, dietary modifications are recommended to limit copper intake, including avoiding foods high in copper, such as shellfish, nuts, and chocolate.

Is Wilson’s Disease Autoimmune?

Wilson’s disease is not an autoimmune disorder. It is a genetic disorder caused by mutations in the ATP7B gene, leading to defective copper metabolism. Unlike autoimmune diseases, where the immune system mistakenly attacks the body tissues, Wilson’s disease involves the accumulation of copper due to a metabolic defect, not an immune response. However, the liver damage and neurological symptoms seen in Wilson’s disease can sometimes resemble those seen in autoimmune conditions, which can complicate diagnosis.

Summary

Wilson’s disease is a rare, inherited disorder resulting from mutations in the ATP7B gene, leading to toxic copper accumulation in vital organs. This autosomal recessive condition affects approximately 1 in 30,000 to 40,000 individuals globally. Symptoms can vary widely, making early diagnosis challenging. Treatment primarily involves chelation therapy, zinc salts, and dietary modifications to manage copper levels. Despite its severe impact, Wilson’s disease is not an autoimmune condition but a genetic disorder affecting copper metabolism. Early detection and treatment are crucial to preventing serious complications and ensuring a better quality of life for affected individuals.

References

  1. https://www.ncbi.nlm.nih.gov/pmc/articles/PMC5648646/
  2. https://www.nature.com/articles/s41598-020-70366-7
  3. https://www.ncbi.nlm.nih.gov/pmc/articles/PMC9239485/
  4. https://wilsondisease.org/living-with-wilson-disease/treatment/#:~:text=Chelation%20therapy%20drugs%20approved%20for,causing%20its%20increased%20urinary%20excretion

What Role Do Your Genes Play in the Formation of Bunions?

Bunions

Disclaimer: This article is for informational purposes only and is not intended to diagnose any conditions. LifeDNA does not provide diagnostic services for any conditions mentioned in this or any other article.

What Are Bunions?

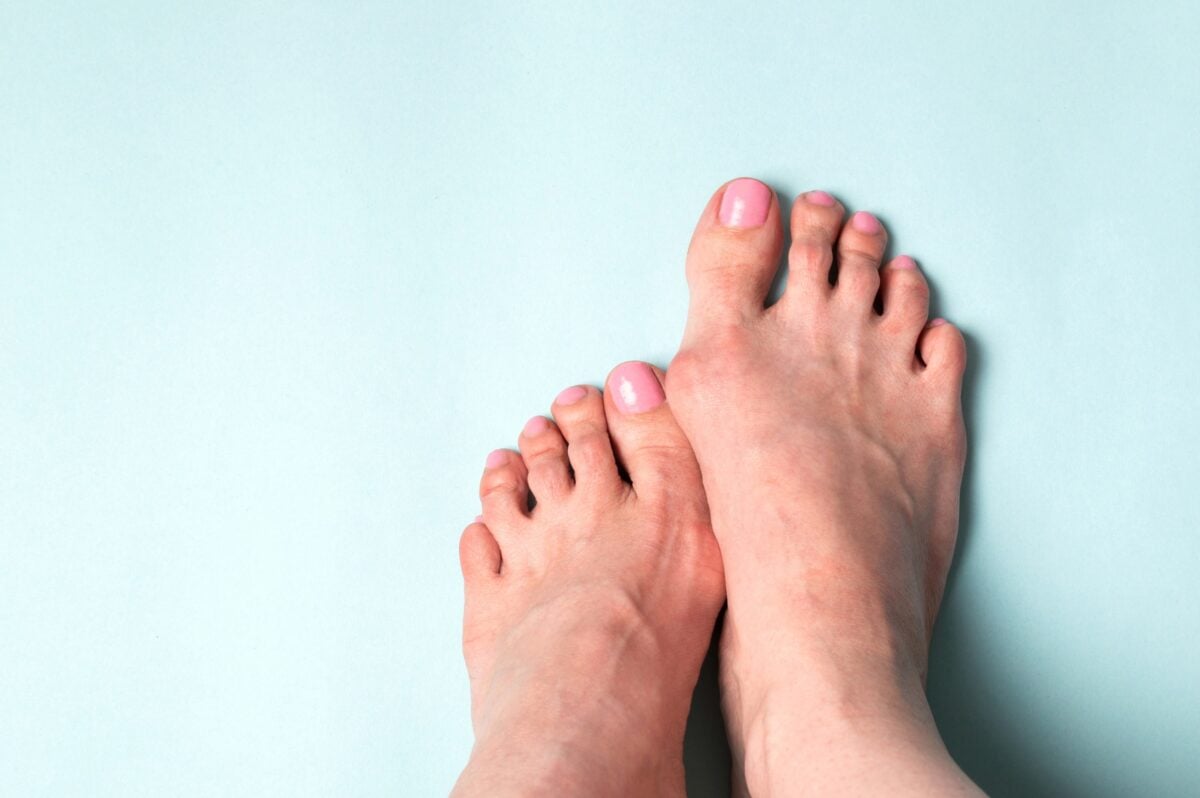
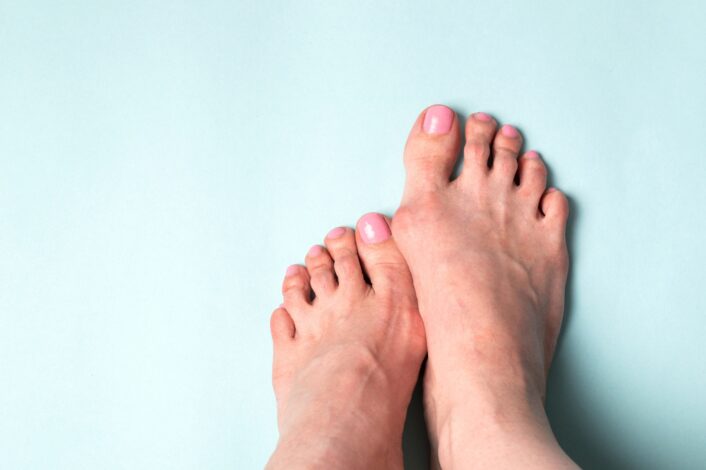
Have you ever noticed a bony bump at the base of your big toe? This common foot deformity is known as a bunion or hallux valgus. The big toe anchors your foot, connecting to the first toe bone through the metatarsophalangeal (MTP) joint, which helps distribute your weight as you walk. When this joint develops a problem, the bones can shift out of alignment, causing the big toe to lean towards the smaller toes and the joint base to protrude, often leading to red, sore skin over the area.

Genetics play a significant role in bunions, with 70% of affected individuals having family members who also experience them. While bunions may appear early in life due to genetic predispositions, they often develop during adulthood. Factors such as repetitive minor injuries from wearing high-heeled or narrow-toed shoes may contribute to their formation. Bunions are more common in adults, particularly affecting women more than men.

What Causes Bunions?

The exact reasons for bunions aren’t fully known, but experts think both inherited traits and lifestyle choices are involved. Here are the possible genetic and environmental causes for bunions:

Genetic Causes of Bunions

Inherited Factors and Foot Mechanics: Genetics may influence bunion development by shaping foot structures such as flat feet, low arches, or overly flexible joints and tendons. These inherited traits alter foot, leading to gradual misalignment of the big toe joint over time.

Congenital Deformities: Some individuals are born with foot deformities that predispose them to bunions. These congenital issues, such as abnormal bone shapes or joint structures, contribute to misalignment and bunion development from an early age.

Genetic dispositions to bunions are discussed more in detail further in this article.

Non-Genetic Causes of Bunions

Impact of Footwear: Wearing shoes that don’t fit well, particularly high heels or narrow-toed shoes, may worsen bunion risk. High heels push body weight forward, increasing pressure on the front of the foot and toes. Over time, this pressure can misalign the big toe joint and lead to bunion formation. Women are more susceptible, often due to their choice of footwear.

Arthritis and Bunion Development: Conditions like osteoarthritis and rheumatoid arthritis may contribute to bunion development by causing joint inflammation and cartilage breakdown. These factors may lead to pain, deformity, and instability in the MTP joint.

Foot Stress and Injuries: Repetitive stress or injuries to the foot, often from activities like ballet dancing, may increase the risk of bunion formation. Such injuries may destabilize the MTP joint, causing bones to shift out of place.

What Are The Symptoms of Bunions? 

The signs and symptoms of a bunion include:

Bulging Bump: A noticeable bulge at the base of the big toe is the most common symptom of a bunion. This bony bump forms as the big toe joint becomes misaligned and may vary in size and severity, depending on the extent of the misalignment.

Swelling, Redness, or Soreness: The skin over the bunion may become swollen, red, and sore due to the constant pressure from shoes. Inflammation and irritation of the surrounding soft tissues may lead to discomfort and pain, especially when walking or wearing tight footwear.

Corns or Calluses: Corns or calluses may develop on the overlapping first and second toes due to the constant rubbing and pressure. These thickened layers of skin form as a protective response to the friction and may cause additional pain and discomfort.

Ongoing Pain: The pain can range from mild to severe and may be accompanied by a burning sensation or aching in the affected joint which may worsen with prolonged standing, walking, or wearing tight shoes.

Limited Movement: The misalignment and inflammation can make it difficult to bend or straighten the toe, affecting your overall foot function which may lead to restricted movement of the big toe joint. 

Genetic Disposition to Bunions

A study involving patients and their family members with hallux valgus (HV), or bunions,  was conducted in 2007 to understand its hereditary patterns. Over a year, 1174 patients with painful bunion deformities underwent X-ray imaging and filled out detailed family history forms. The proband consisted of350 individuals (22 men, 328 women; average age 47.8 years), with a ratio of about 1 man for every 15 women. They found that in the families of 244 out of the 350 patients, three or more members had HV; in 71 families, two members were affected;and in 35 families, only the patient themselves showed symptoms. The study observed that females were more likely to have parents and relatives affected by HV. However, the severity of HV did not significantly vary based on gender or affected family members. The presence of a family history of bunions in 90% of patients and the condition appearing across multiple generations suggests that HV may be inherited dominantly but not everyone with the genetic predisposition develops symptoms.

A more recent study of 2021 involved 10 participants from three independent families, including 7 individuals affected by HV and 3 unaffected, and used whole exome sequencing, a type of DNAsequencing  currently used  to understand the genetic causes of symptoms or diseases. The DNA analysis identified significant genetic factors linked to bunions. The study identified 36 different genes potentially associated with HV, including TTN, COL6A3, and LARS, which are known for their role in influencing the development of long toes and fingers. Additionally, genes like FIG4 and CBS, which are associated with digital anomalies, were highlighted. The C7 gene which was associated with bunions is also linked to chronic arthritis, and may contribute to HV by promoting inflammation. 

How Are Bunions Diagnosed?

Bunions are diagnosed through a physical examination, where your doctor will look for signs such as a noticeable bump at the base of your big toe, along with swelling, redness, soreness, and limitations in toe or foot movement. X-rays are commonly used to assess the severity of the condition and the alignment of bones.

Health Impact or Complications of Bunions:

Bunions may lead to several complications if left untreated, impacting the overall health and functionality of your feet. Here are some possible complications of bunions:

Bursitis: This condition is the inflammation of the small fluid-filled pads (bursa) that cushion the bones near joints. Bunions create extra pressure and friction at the joint of the big toe. Over time, this persistent stress can irritate and inflame the bursa. The inflammation of the bursa, known as bursitis, results in pain, swelling, and restricted movement in the affected area.

Hammertoe: This occurs when the middle joint of a toe, typically the second toe, bends abnormally, often due to the pressure from a bunion altering foot mechanics. Symptoms include a visible bend, pain, and corns or calluses from friction.

Metatarsalgia: Refers to pain and inflammation in the ball of the foot, often caused by the altered weight distribution due to a bunion. This condition results in sharp or aching pain, swelling, and a sensation of walking on a pebble. 

Can You Treat Bunions? 

Treatment options vary depending on the severity of your bunion and the pain it causes. These include both non surgical and surgical methods.

Non-Surgical Options:

Nonsurgical treatments that may relieve the pain and pressure of a bunion include:

Changing shoes: Wear roomy, comfortable shoes that provide plenty of space for your toes.

Medications: Pain relief for bunions may often be managed with over-the-counter pain relievers and anti-inflammatory treatments to reduce pain and swelling. It is important to seek advice from a healthcare professional before starting any medication or treatment plan to ensure it is appropriate for your specific condition.

Shoe inserts: Padded shoe inserts may help distribute pressure evenly when you move your feet, reducing symptoms and preventing the bunion from getting worse.

Applying ice: Icing your bunion after you’ve been on your feet too long or if it becomes inflamed may help relieve soreness and swelling.

Surgical Options

If non surgical treatment doesn’t relieve your symptoms, surgery might be necessary. Surgery is not recommended for cosmetic reasons but only when a bunion causes frequent pain or interferes with daily activities. There are various surgical procedures for bunions, which can be done as single procedures or in combination. These might involve:

Osteotomy: Involves cutting and realigning the bone of the big toe. The surgeon makes small cuts in the bones to shift them into the correct position, held together with screws or pins. This procedure is often combined with other techniques to correct the toe’s alignment.

Exostectomy: Involves removing the bony bump from the toe joint without performing an alignment. While this can reduce pain and improve shoe fit, it does not address the underlying cause of the bunion and is usually combined with other procedures for long-term correction.

Arthrodesis: Involves surgical fusion of the big toe joint, creating a permanent bond between the bones. This procedure is used for severe bunions, particularly in cases where arthritis affects the toe joint. It eliminates joint movement, reduces pain and corrects deformity.

Lapidus Procedure: This procedure addresses hypermobility in the joint, by stabilizing the foot and realigning the toe. It involves fusing the first metatarsal bone to the medial cuneiform bone to correct severe bunions and prevent recurrence

Resection Arthroplasty: Involves removing the damaged portion of the toe joint to create a flexible scar tissue joint. This procedure is less common and usually reserved for older patients or those with severe arthritis and poor bone quality.

Summary

  • Bunions, or hallux valgus (HV), are bony bumps that form on the joint at the base of the big toe.
  • Both genetic factors and environmental influences contribute to the development of bunions.
  • Genetic factors are significant in the formation of bunions, with 70% of those affected having a family history of the condition.
  • Proper foot care and wearing appropriate footwear can help manage bunions and prevent them from getting worse.
  • Bunion pain can greatly affect daily activities and foot function.
  • Genes like TTN, COL6A3, LARS, FIG4, CBS, and C7 may be linked to the development of bunions.
  • Bunions are more common in adults and women, often associated with repetitive foot injuries and inflammatory conditions.
  • Symptoms of bunions include a visible bump, redness, swelling, soreness, corns, calluses, ongoing pain, and limited toe movement.
  • Inherited foot shapes, foot stress, congenital deformities, and arthritis increase the risk of developing bunions.
  • Diagnosis of bunions involves a physical examination, X-rays, and sometimes blood tests to rule out other conditions.
  • Untreated bunions can lead to complications such as bursitis, hammertoe, and metatarsalgia.
  • Surgery is considered for bunions only when they cause significant pain or interfere with daily life.
  • Preventive measures include choosing shoes with a wide toe box and adequate foot support.
  • Discovery of certain associated genes suggest that bunions may result from abnormal bone growth and chronic inflammation.
  • Understanding the genetic causes of bunions can help in early detection and targeted treatment strategies.

References

  1. https://www.lifespan.org/lifespan-living/what-are-bunions-signs-causes-treatments
  2. https://www.mayoclinic.org/diseases-conditions/bunions/symptoms-causes/syc-20354799
  3. https://www.health.harvard.edu/diseases-and-conditions/what-to-do-about-bunions
  4. https://www.mayoclinic.org/diseases-conditions/bunions/diagnosis-treatment/drc-20354805
  5. https://www.mayoclinic.org/diseases-conditions/bunions/diagnosis-treatment/drc-20354805
  6. https://orthoinfo.aaos.org/en/diseases–conditions/bunions/
  7. https://radiopaedia.org/articles/hallux-valgus
  8. https://www.mayoclinic.org/diseases-conditions/metatarsalgia/symptoms-causes/syc-20354790
  9. https://www.thefootcompany.co.uk/blog/are-bunions-genetic

What Your Unibrow Might Say About Your Genetic Makeup

A woman with a noticeable unibrow, showcasing a unique facial feature that may offer insights into her genetic makeup.

Disclaimer: This article is for informational purposes only and is not intended to diagnose any conditions. LifeDNA does not provide diagnostic services for any conditions mentioned in this or any other article.

Overview

Eyebrows, the strips of hair located above our eyes, play a critical role in both protecting our eyes and contributing to our facial expressions. They help to divert sweat, water, and debris away from the eyes, and their movement is key in conveying emotions like surprise, concern, or confusion. The shape, thickness, and color of eyebrows vary widely among individuals and are largely influenced by genetic factors.

One such variation is the unibrow, where both eyebrows meet in a single, continuous line across the forehead. While it may seem like just another quirky feature, a research study by Pramod Kumar shows that unibrows are more than just a matter of style or chance—they are linked to genetic factors, notably the PAX3 gene. This connection highlights how our DNA variation influences even the smallest aspects of our appearance, like the unibrow. Whether bold or understated, your eyebrows are a reflection of the genetic blueprint that makes you unique.

Why Do We Have Eyebrows?

Eyebrows serve several practical functions, both in terms of protection and social interaction. From an evolutionary perspective, one significant purpose of eyebrows is to protect our eyes by diverting sweat, water, and debris away from them. This protective function likely offered an evolutionary advantage by helping to maintain clear vision in various environments.

Eyebrows have evolved to also play a crucial role in social communication. Unlike other body hair, eyebrows are highly expressive and are integral to conveying a wide range of emotions, such as happiness, surprise, anger, or sadness. This ability to communicate non-verbally would have been particularly important in early human societies, where effectively expressing emotions and intentions was essential for social interaction and cohesion.

Research has also highlighted the importance of eyebrows in facial recognition. A study conducted by researchers at MIT found that people struggled to recognize familiar faces when eyebrows were digitally removed from photographs. From an evolutionary perspective, this trait may have been advantageous in small social groups, where recognizing and remembering faces was important for maintaining social bonds and avoiding conflict.

Genetics of Eyebrows

Are Eyebrows Influenced by Genetics?

The shape, thickness, and color of eyebrows vary widely among individuals and the characteristics of your eyebrows are primarily determined by genetics, although environmental factors and personal grooming may also influence their appearance. Research has identified several genes associated with eyebrow traits such as shape, thickness, and color. For example, the gene FOXL2 has been linked to eyebrow thickness, while EDAR is associated with eyebrow thickness and hair texture, and for example, PAX3 is linked to the presence of a unibrow. However, these traits are polygenic, meaning they are influenced by the interactions of multiple genes, not only the few mentioned here. This complexity means that while certain key genes have been identified, our understanding of the full genetic picture is still evolving.

What specific genes are associated with Unibrows and other hair characteristics?

In a study conducted by researchers analyzing the DNA sequences of 6,630 people in Latin America, who had a mix of Caucasian, African American, and Native American ancestry, several specific genes tied to having a unibrow and bushy eyebrows were identified. The study also uncovered why some people might have thick, luxuriant heads of hair but maintain thin eyebrows or smooth baby faces throughout their lives. The findings suggest that different genes are responsible for hair type, beard thickness, eyebrow thickness, and the presence of a unibrow.

Here are the key genes mentioned in the scientific study:

  • PRSS53 – This gene was identified as influencing hair curliness.
  • IRF4 – This gene is involved in hair color and was specifically noted for its role in the graying of hair.
  • EDAR – This gene is associated with hair thickness and straight hair, particularly noted in populations with East Asian ancestry.
  • FOXL2 – This gene is linked to eyebrow thickness, and variations in this gene influence the bushiness of eyebrows.
  • PAX3 – This gene was specifically associated with the presence of a unibrow.

Interestingly, the study found that these variations are not just random events. Researchers proposed that people’s sexual preferences, such as for long, straight locks or hairless faces, may have driven these genetic changes. However, it’s also possible that the genes for these traits evolved alongside other, yet unidentified traits that offered advantages in ancestral environments.

How Are Eyebrow Traits Inherited?

Understanding how eyebrow traits are inherited involves examining the interactions of multiple genes. For instance, genes that control hair texture and color across your body, like MC1R for hair color and LIM2 for hair structure, also influence your eyebrows. This is why eyebrow traits can sometimes be linked to other hair traits across your body, such as the texture or color of the hair on your head.

The inheritance of these traits follows the basic principles of genetics: each individual inherits one set of gene versions from their mother and another set from their father. These gene versions can combine in various ways, leading to a wide range of eyebrow appearances even within the same family. In the case of unibrows, the trait can be inherited in a similar manner. If one or both parents carry the genetic markers associated with a unibrow, there is a higher likelihood that their offspring may also exhibit this feature. However, the exact genetic underpinnings of a unibrow remain an area of ongoing research, and all the specific genes involved have not yet been conclusively identified.

Is the Appearance of Eyebrows Permanent?

No, the appearance of eyebrows is not entirely permanent. While the basic shape and thickness are largely determined by genetics and tend to remain stable, factors like aging, hormonal changes, and grooming habits can cause changes over time. Aging can lead to thinning and lighter eyebrows, while grooming practices like plucking or waxing can potentially reduce regrowth in some areas.

Non-Genetics of Eyebrows

Hormones play a key role in the development and appearance of your eyebrows throughout life. During puberty, increased androgens like testosterone can thicken eyebrows, especially in males. As we age, hormonal changes, such as decreased estrogen in women during menopause, can lead to thinner, lighter, or coarser eyebrows. Some may also notice longer, more unruly eyebrow hairs that require more frequent grooming. These changes reflect the natural shifts in hormone levels over time.

Can Eyebrow Traits Indicate Health Conditions?

While the shape and thickness of your eyebrows are generally considered aesthetic traits, they can sometimes be indicators of underlying health conditions or genetic predispositions. Here are a few considerations:

  1. Hair Growth Disorders: Hair growth patterns in eyebrows can sometimes signal underlying disorders, such as alopecia areata, which causes patchy hair loss, or hypothyroidism, which may lead to thinning eyebrows, particularly in the outer third.These changes in eyebrow hair can be an early sign of these conditions and warrant further medical evaluation.

You might like to read:  Male Pattern Baldness

  1. Genetic Syndromes: In rare cases, abnormal eyebrow development can be a sign of certain genetic syndromes, such as Cornelia de Lange syndrome, which is characterized by highly arched eyebrows along with other distinct facial features and developmental issues. Eyebrow abnormalities in these syndromes are usually accompanied by other clinical signs, making them part of a broader diagnostic picture. 

Can Unibrow Traits Indicate Health Conditions?

A unibrow is generally a benign genetic trait, but it can sometimes be associated with certain health conditions. In rare cases, a unibrow can be a characteristic of genetic disorders such as the Cornelia de Lange syndrome, which involves developmental delays and other physical abnormalities. However, for most people, a unibrow is simply a natural variation in hair growth without any health implications. 

Interestingly, findings from Pramod Kumar’s epidemiological study identified a prevalence of 11.87% for synophrys (unibrow) in the Omani population, and revealed that no genetic disorders were associated with the cases studied. This suggests that the presence of a unibrow often occurs independently of any underlying genetic conditions, challenging the assumption that unibrows are primarily linked to health complications. 

How Do Skin Conditions Affect Eyebrows?

The appearance of your brows can be affected by various underlying skin conditions due to inflammation around the hair follicles, which disrupts normal hair growth and leads to thinning eyebrows. Conditions like dandruff  psoriasis, and eczema may directly affect this area, leading to symptoms like flaking, irritation, and even hair loss. These conditions can cause inflammation around the hair follicles, disrupting normal hair growth and leading to thinning eyebrows. For instance, dandruff (seborrheic dermatitis), characterized by red, itchy, and flaky skin, often affects areas with a high density of oil glands, including the eyebrows, and can cause significant discomfort and hair loss if left untreated. Similarly, psoriasis, an autoimmune condition that results in thick, scaly patches of skin, can impact the eyebrows, causing hair to fall out in affected areas.

How can you maintain healthy skin in the area between your eyebrows?

In terms of skin health, the area between the eyebrows is also prone to conditions like seborrheic dermatitis and psoriasis, which can cause irritation and impact hair growth, including in the unibrow area. Regular skin care and management of any underlying conditions are essential to maintaining the health of both your skin and your eyebrows, whether you have a unibrow or not.

To maintain healthy skin under your eyebrows, it’s important to follow a gentle skincare routine:

  • Using gentle exfoliants: Exfoliating the skin beneath your eyebrows can help remove dead skin cells and prevent clogged follicles. Use mild products and consider patch-testing new exfoliants if you have sensitive skin.
  • Moisturizing regularly: Keeping the skin hydrated is essential, especially for those with conditions like eczema or dermatitis. Opt for non-comedogenic moisturizers that won’t clog pores and aggravate the skin.
  • Avoiding harsh chemicals: Products with strong chemicals, such as certain makeup removers or acne treatments, can irritate the delicate skin around your eyebrows and lead to hair loss. 

Can You Alter Your Unibrow Traits?

Youmay alter your unibrow traits, but the extent to which you can do so depends on the method used.

  • Grooming: The most common way to alter a unibrow is through grooming methods such as plucking, waxing, threading, or shaving. These methods are temporary and need to be repeated regularly to maintain the desired look.
  • Permanent Hair Removal: For a more long-term solution, methods like laser hair removal or electrolysis can be used to reduce or eliminate hair growth in the unibrow area. These treatments target the hair follicles, leading to a reduction in regrowth over time.
  • Cosmetic Procedures: In some cases, individuals may opt for cosmetic procedures like microblading to reshape their eyebrows, though this typically focuses on adding hair rather than removing it.
  • Genetic Factors: While these external methods can change the appearance of a unibrow, the underlying genetic traits that cause it cannot be altered. Therefore, if you stop grooming or treatment, the unibrow may return.

Summary

  • Eyebrows protect the eyes by diverting sweat, water, and debris, and play a role in facial expressions.
  • The shape, thickness, and color of eyebrows are influenced by genetics, with specific genes such as PAX3 is linked to unibrows.
  • Eyebrows are crucial for social communication and facial recognition.
  • Traits like eyebrow shape and thickness are polygenic, influenced by multiple genes.
  • Hormonal changes affect eyebrow appearance, with aging leading to thinning or coarser eyebrows.
  • Eyebrow traits can sometimes indicate health conditions, such as alopecia or hypothyroidism.
  • Skin conditions like seborrheic dermatitis and psoriasis can affect eyebrow health, causing irritation and hair loss.
  • Maintaining healthy skin under the eyebrows involves gentle exfoliation, regular moisturizing, and avoiding harsh chemicals.
  • Unibrow traits can be altered through grooming, permanent hair removal, or cosmetic procedures, but the underlying genetic factors remain unchanged.

References:

  1. https://www.nature.com/articles/ncomms10815
  2. https://pubmed.ncbi.nlm.nih.gov/7581459/
  3. https://www.ncbi.nlm.nih.gov/pmc/articles/PMC6250454/
  4. https://www.researchgate.net/publication/267208316_Facial_width-to-height_ratio_predicts_self-reported_dominance_and_aggression_in_males_and_females_but_a_measure_of_masculinity_does_not
  5. https://www.researchgate.net/publication/350439836_Microblading_and_the_Science_Behind_it
  6. https://www.researchgate.net/publication/51692981_The_effect_of_menopause_on_the_skin_and_other_connective_tissues
  7. https://www.researchgate.net/publication/10776606_The_Role_of_Eyebrows_in_Face_Recognition
  8. https://www.researchgate.net/publication/10776606_The_Role_of_Eyebrows_in_Face_Recognition
  9. https://www.researchgate.net/publication/325720792_Genome-wide_association_study_in_Japanese_females_identifies_fifteen_novel_skin-related_trait_associations
  10. https://pubmed.ncbi.nlm.nih.gov/23110848/
  11. https://onlinelibrary.wiley.com/doi/abs/10.1111/j.1529-8019.2008.00214.x
  12. https://www.mayoclinic.org/healthy-lifestyle/stress-management/expert-answers/stress-and-hair-loss/faq-20057820
  13. https://www.researchgate.net/publication/310493260_Fashion_Work_and_Politics_in_Modern_France 
  14. https://web.mit.edu/sinhalab/Papers/sinha_eyebrows.pdf 
  15. https://medlineplus.gov/genetics/condition/cornelia-de-lange-syndrome/ 

What Your Finger Length Ratios Tell About Your Health and Behavior

Finger Length Ratios

Disclaimer: This article is for informational purposes only and is not intended to diagnose any conditions. LifeDNA does not provide diagnostic services for any conditions mentioned in this or any other article.

Overview

Have you ever wondered how something as simple as the length of your fingers could reveal insights into your health and personality? The 2D:4D ratio of finger length ratio, which compares the lengths of your index and ring fingers, is emerging as a fascinating biomarker in scientific research. It became well-known after John Manning’s research in 1998, which suggested that this ratio could show the levels of testosterone and estrogen you were exposed to in the womb.  

Studies have linked the 2D:4D ratio to various traits and behaviors, like aggression, sexual orientation, and even risks for conditions such as autism and addiction. It even helps understand links between early hormonal exposure and various outcomes, such as heart disease, mental health issues, and even personality traits. However, there’s still debate over its reliability and whether it truly reflects prenatal hormone exposure.

What Is the Finger Length Ratio?

The finger length ratio, or 2D:4D ratio, measures the length of your index finger (2D) compared to your ring finger (4D). Men usually have a lower ratio, meaning their ring fingers are longer than their index fingers. This ratio is thought to reflect the balance of testosterone and estrogen they were exposed to while in the womb. Researchers use tools like calipers and scanners to measure these ratios, exploring their links to various traits and behaviors. 

How Does the 2D:4D Ratio Relate to Health Conditions?

A recent study by researchers from Swansea University and the University of Central Lancashire explored the relationship between finger length ratios, specifically the 2D:4D ratio, and oxygen metabolism efficiency by examining 133 professional male football players. They measured the players’ finger lengths and assessed their oxygen metabolism and maximal oxygen consumption through cardiopulmonary tests on a treadmill. The findings revealed that players with a lower 2D:4D ratio, meaning longer ring fingers relative to index fingers, exhibited more efficient oxygen metabolism and higher maximal oxygen consumption. This suggests that prenatal testosterone exposure, which influences this finger ratio, may also affect mitochondrial function and energy production. 

These results align with previous research linking a lower 2D:4D ratio to better performance in distance running, reduced severity of diseases like Covid-19, and a decreased risk of heart disease. Professor John Manning emphasized the potential of the 2D:4D ratio as a marker for understanding metabolic processes related to health outcomes and called for further research to explore these associations, especially in women who were not part of the Manning study. This study adds to the growing evidence of the biological significance of finger length ratios in health and disease.

Another study titled The Ratio of Second to Fourth Digit Length (2D:4D) and Coronary Artery Disease in a Han Chinese Population explores whether the 2D:4D ratio,can serve as an indicator for susceptibility to coronary artery disease (CAD) among a Chinese population. In this study, researchers analyzed 1,764 participants, dividing them into four groups: 441 men with CAD, 441 men without CAD, 441 women with CAD, and 441 women without CAD. Finger lengths were meticulously measured using electronic calipers, and statistical methods, including receiver operating characteristic (ROC) curves, were employed to evaluate the potential diagnostic value of the 2D:4D ratio for CAD.

The results revealed that in men, the 2D:4D ratio was significantly higher among those with CAD compared to those without. Specifically, the right-hand 2D:4D ratio demonstrated a moderate diagnostic value with an area under the curve (AUC) of 0.72, suggesting that this ratio could be a useful marker for CAD risk in males. Conversely, the study did not find a significant difference in the 2D:4D ratios between women with CAD and those without, indicating that the ratio might not be a reliable indicator for CAD risk in women.

The findings align with previous research linking a higher 2D:4D ratio with increased CAD risk in men. This association is thought to be related to prenatal hormone exposure, as the 2D:4D ratio reflects hormonal influences during fetal development. However, these studies show the need for further investigation to fully understand the relationship and to determine its applicability in broader populations.

Psychological and Behavioral Implications of 2D:4D Ratio

Researchers have found a link between the relative lengths of index and ring fingers and certain psychopathological personality traits, including antisocial behaviors and substance use disorders. A study published in the Journal of Psychiatric Research, included 80 participants: 44 individuals with clinical diagnoses (25 with Amphetamine Use Disorder (AUD), 10 with Antisocial Personality Disorder (ASPD), and 9 with both AUD and ASPD) and 36 healthy controls. The findings indicate that people with certain psychiatric disorders have a notably different finger length ratio compared to healthy individuals.

In this very recent study, the participants underwent psychological assessments, including measures of Dark Triad traits (Machiavellianism, narcissism, and psychopathy), and had their finger lengths scanned to calculate the 2D:4D ratio.

Findings revealed that the group with clinical diagnoses had significantly lower 2D:4D ratios than the healthy control group, indicating longer ring fingers relative to index fingers in those with AUD and ASPD. Males across all groups also had lower 2D:4D ratios than females. The study found that lower 2D:4D ratios were associated with higher scores in Dark Triad traits, suggesting a link between prenatal hormone exposure and these traits.

These results suggest that the 2D:4D ratio could be used as a non-invasive biomarker for predicting certain personality traits and susceptibilities.

A different  study looked at how the ratio of finger lengths (2D:4D ratio) relates to personality traits in people from China and Germany. Researchers used special scanners and GIMP software to measure the finger ratios and assessed personality using a detailed questionnaire. As expected, t found that men generally had smaller 2D:4D ratios than women, with no big differences between the Chinese and German participants.

Personality assessments revealed that in general the females scored higher on Neuroticism, Openness, Agreeableness, and Conscientiousness, especially in Germany. Analysis showed that a higher 2D:4D ratio (more “feminine”) was linked to higher Neuroticism in women, but results for men varied. The study suggests that while a more “feminine” finger ratio often means higher Neuroticism in women, more research is needed to understand why this is and how other factors might play a role.

Yet another study looked at how the2D:4D ratio relates to physical aggression in men and women. It found that men with shorter index fingers compared to their ring fingers (a more masculine ratio) were more likely to be physically aggressive. However, there was no such link in women. This suggests that higher levels of testosterone before birth might be connected to increased physical aggression in men.

Current Genetic Studies in Finger Length Ratios 

In the largest genome-wide association study (GWAS) on the 2D:4D finger ratio to date, researchers analyzed data from over 15,000 individuals in the discovery phase and more than 75,000 in the replication phase. The study aimed to uncover genetic factors influencing the 2D:4D ratio, a trait often used as a non-invasive marker for prenatal testosterone exposure. The research identified 11 loci associated with the 2D:4D ratio, including nine new loci such as rs11581730 on chromosome 1q22, rs12474669 on chromosome 2q31.1, rs77640775 on chromosome 7p14.1, rs10790969 on chromosome 11q24.3, rs6499762, rs1080014 on chromosome 16q12.1, and rs4799176 on chromosome 18q23.

This study provides new insights into the genetics of the 2D:4D ratio, uncovering several novel genetic loci and questioning the strength of the 2D:4D ratio simply as a biomarker for prenatal androgen exposure.

Summary

  • The 2D:4D ratio measures the length of the index finger (2D) relative to the ring finger (4D).
  • The finger length ratio is thought to reflect prenatal exposure to testosterone and estrogen.
  • Men typically have a lower 2D:4D ratio, meaning their ring fingers are longer compared to their index fingers.
  • The 2D:4D ratio became well-known through John Manning’s 1998 research.
  • The ratio may provide insights into early hormonal exposure and its effects on health.
  • Lower 2D:4D ratios have also been associated with reduced severity of diseases like Covid-19.
  • A study found that football players with a lower 2D:4D ratio had more efficient oxygen metabolism and higher maximal oxygen consumption.
  • renatal testosterone exposure, reflected in a lower 2D:4D ratio, may influence mitochondrial function and energy production.
  • A finding of high 2D:4D ratio in men with coronary artery disease (CAD), indicates thatit might be a useful marker for CAD risk in males but not in women.
  • Research on psychological traits has shown that individuals with certain psychiatric disorders have different 2D:4D ratios compared to healthy individuals.
  • Lower 2D:4D ratios have beenlinked to higher scores in Dark Triad traits (Machiavellianism, narcissism, and psychopathy).
  • Higher 2D:4D ratio in women has been associated with higher Neuroticism.
  • In men, shorter index fingers compared to ring fingers were linked to increased physical aggression.
  • Studies comparing 2D:4D ratios in China and Germany showed men had lower ratios than women, with variations in personality traits.
  • Recent genetic studies have identified 11 loci associated with the 2D:4D ratio.New loci include SNPs rs11581730, rs12474669, rs77640775, rs10790969, rs6499762, rs1080014, and rs4799176.

References

  1. https://www.psypost.org/surprising-connection-found-between-finger-length-ratios-and-psychopathological-traits/
  2. https://www.news-medical.net/news/20240216/Study-links-finger-length-ratio-to-oxygen-metabolism-efficiency-in-athletes.aspx
  3. https://www.science.org/content/article/talk-hand-scientists-try-debunk-idea-finger-length-can-reveal-personality-and-health
  4. https://www.semanticscholar.org/paper/Finger-length-ratio-(2D%3A4D)-correlates-with-in-men-Bailey-Hurd/78cfab65f333ab6276aaeddc4afca73f10f9f5d3
  5. https://pubmed.ncbi.nlm.nih.gov/15620791/
  6. https://www.ncbi.nlm.nih.gov/pmc/articles/PMC3775119/

What Your Basophil Count Tells You About Your Health Status

A man with a bone injury, illustrating how basophil count can relate to inflammation and health.

Disclaimer: This article is for informational purposes only and is not intended to diagnose any conditions. LifeDNA does not provide diagnostic services for any conditions mentioned in this or any other article. 

What is a Basophil?

Basophils are a type of white blood cells, or leukocytes, that play a key role in your immune system. As one of three types of granulocytes (along with neutrophils and eosinophils), basophils are characterized by the presence of granules in their cytoplasm. These granules store substances like histamine and heparin, which are vital in triggering inflammatory responses and defending your body. Although they are the smallest in number, basophils are the largest in size among the granulocytes.

Basophils are essential for your body’s response to allergens, pathogens, and parasites. During an allergic reaction, for instance, they release histamine, which is responsible for symptoms like sneezing or a runny nose. Their granules also contain heparin, which helps prevent blood clotting. Interestingly, basophils don’t recognize pathogens they’ve previously encountered; instead, they attack any unfamiliar organisms they encounter by surrounding and digesting them through a process called phagocytosis.

Though basophils are crucial for immune defense, their lifespan is relatively short, typically ranging from a few hours to a few days.

Basophils help protect your body against allergens, bacterial, viral, and fungal infections (pathogens), blood clotting disorders, and parasites.

What is Basophil Count?

A basophil count refers to the number of basophils circulating in your blood and is typically measured during a complete blood count (CBC) test. This count can be expressed either as a percentage of your total white blood cells or as an absolute number of basophils per microliter of blood.

The basophil count gives doctors insight into your immune system’s activity, especially when it comes to inflammation, allergic reactions, and potential infections. Elevated or decreased basophil counts can indicate various health conditions, from allergies and infections to blood disorders.

How Do Basophils Function?

When the body senses a threat—be it an allergen, infection, or injury—basophils are among the first cells to respond. Their primary function is to initiate inflammation, the body’s natural alarm system that triggers the immune response and initiates the healing process.

Inside each basophil are tiny granules that store critical substances, most notably histamine and heparin. When a threat is detected, these granules are released into the bloodstream to perform specific functions. Histamine acts as a signal to widen the blood vessels, allowing more immune cells to flood the affected area. This increase in blood flow is not random; it’s a deliberate attempt by the immune system to deliver reinforcements to the site as quickly as possible. The side effects—such as swelling and redness—are visible markers of this response, especially during allergic reactions

At the same time, heparin acts as an anticoagulant, preventing blood clots from forming too quickly. This ensures that blood continues to flow freely. While clotting is important to stop bleeding, too much clotting at the site of an infection or injury can block the immune system’s ability to do its job. By thinning the blood slightly, heparin keeps the circulation moving, allowing essential immune cells to reach the damaged tissues and assist in the healing process.

But basophils don’t work alone. They also release chemical signals that attract additional white blood cells, like neutrophils and eosinophils, strengthening the body’s response to infection or injury.

In another function, basophils also indirectly support the immune system by engaging B-cell lymphocytes. When they bind to these cells, it triggers the release of immunoglobulin E (IgE) antibodies. These antibodies are particularly adept at targeting parasites and neutralizing venoms.

How Do You Measure Basophil Count?

Basophil count is typically measured through a routine blood test called a complete blood count (CBC) with differential. During this test, a healthcare provider takes a blood sample, which is sent to a lab for analysis. The CBC provides a comprehensive overview of various blood components, including red blood cells, platelets, and different types of white blood cells—such as basophils, eosinophils, neutrophils, lymphocytes, and monocytes.

When your doctor orders a CBC with differential, it helps them evaluate the health and function of your white blood cells. This test can determine whether your basophil count is within the normal range, too high, or too low, which may help identify potential infections, immune disorders, or other health conditions.

There are methods for assessing the health of basophils:

  • Absolute Basophil Count: This test calculates the exact number of basophils in your blood. It is determined by multiplying the percentage of basophils from the CBC by the total white blood cell count. This result helps doctors determine if the basophil count is elevated, normal, or reduced.
  • Relative Basophil Percentage: This is simply the percentage of basophils relative to the total number of white blood cells. Although it’s less precise than the absolute count, it can still provide a quick view to see if basophils make up a larger or smaller-than-expected proportion of white blood cells, which can be a useful indicator, especially in initial tests.


  • Bone Marrow Biopsy: In cases where more detailed information is needed, a bone marrow biopsy may be performed. During this procedure, a healthcare provider uses a needle to extract a small sample of bone marrow, which is then examined to assess the quality and quantity of blood cells, including basophils, at their source.It’s typically only considered when there’s a need for more in-depth investigation, such as when a blood test reveals consistently abnormal basophil levels alongside other concerning blood abnormalities, or if there are symptoms suggesting a possible bone marrow or blood disorder.

While basophil count can provide important clues about your health, it often serves as an indicator rather than a definitive diagnosis. Additional tests are usually required to confirm the underlying cause of abnormal basophil levels.

What is the Normal Basophil Count?

Basophils are a small but important part of your immune system, making up less than 1% of your total white blood cells. Despite their small numbers, they play a vital role in inflammation and allergic responses.

The normal range for basophil count can differ slightly, but generally accepted ranges are as follows:

  • Percentage of Total White Blood Cells: Basophils typically account for approximately 0.5% to 1% of the total white blood cell count.
  • Absolute Count: In healthy adults, the normal absolute count ranges from 0 to 300 basophils per microliter of blood.

While these values give a general benchmark, they can vary based on factors like age, sex, and individual health conditions. Consequently, it’s important to interpret basophil counts within the broader context of your overall health and medical history. If your basophil levels fall outside these normal ranges, it could signal underlying health issues that may need further investigation.

What Does it Mean if You Have High/Low Basophil Count?

High Basophil Count (Basophilia):

Basophils are crucial for your body’s response to allergens—they’re the reason you might sneeze, cough, or have a runny nose during allergy season or when you come into contact with allergens.When your basophil count is elevated, this condition is known as basophilia.

An unusually high basophil count can indicate various health issues, ranging from relatively common conditions to more serious medical concerns. Here’s a closer look at what elevated basophil levels might signify:

  • Allergic Reactions: Basophils release histamine, a chemical involved in allergic responses. Elevated basophil levels can occur in conditions such as hay fever or asthma, where the body’s immune response to allergens triggers an increase in these cells.
  • Chronic Inflammatory Diseases: Conditions like rheumatoid arthritis and inflammatory bowel disease can lead to higher basophil counts. These diseases cause persistent inflammation, which can stimulate an increase in basophils.
  • Hematologic Disorders: Certain blood disorders, such as chronic myelogenous leukemia (CML) and other myeloproliferative neoplasms, can result in elevated basophil counts. These disorders involve the abnormal production of blood cells and can significantly impact basophil levels.
  • Hypothyroidism: An underactive thyroid gland, or hypothyroidism, may be linked to increased basophil levels. This condition affects various bodily functions and can influence basophil production.
  • Infections: Some chronic infections may also cause an increase in basophil counts. The body’s ongoing immune response to these infections can lead to elevated levels of these cells.

If your basophil count is higher than normal, it’s important to consider these potential causes and consult with a healthcare professional for a comprehensive evaluation. They can help determine the underlying issue and guide appropriate treatment based on your specific health needs.

Low Basophil Count (Basopenia):

A low basophil count, known as basopenia, is less common but can offer important clues about your health. Basopenia may occur when your basophils are working too hard to address an allergen or treat an infection, or due to other underlying conditions. Here are some situations where a low basophil count might be observed:

  • Acute Infections: During acute infections, the body may temporarily reduce basophil levels as part of its response to the immediate threat.
  • Hyperthyroidism: An overactive thyroid gland can lead to lower basophil counts. Excess thyroid hormone affects various bodily functions, including the regulation of basophils.
  • Corticosteroid Use: Medications such as corticosteroids can suppress basophil production. These drugs are often used to manage inflammation and autoimmune conditions.
  • Severe Allergic Reactions: In some instances, intense allergic reactions may cause a decrease in basophil levels as the body adjusts its immune response.
  • Stress: Physical stressors, such as pregnancy or a myocardial infarction (heart attack), can impact basophil counts. Stress affects overall immune function and can lead to fluctuations in basophil levels.
  • Long-Term Therapies: Prolonged use of steroid medications, chemotherapy, or radiation therapy can suppress basophil production and lead to lower counts.

Understanding whether your basophil count is elevated or reduced provides valuable insights into your health. However, it’s important to consider these findings alongside other clinical information and diagnostic tests for a comprehensive evaluation. Consulting with a healthcare professional can help clarify the implications of your basophil count and guide appropriate actions for your overall well-being.

Genetic Disorders Related to Basophil Count

One of the key genetic disorders linked to basophil count is Chronic Myeloid Leukemia (CML), a type of blood cancer caused by a specific genetic mutation. This mutation, known as the Philadelphia chromosome, results from a chromosome translocation, where parts of chromosomes 9 and 22 swap places. This swap creates the BCR-ABL1 gene, which drives the abnormal growth of cancerous blood cells. While many patients with CML respond well to drugs that target the BCR-ABL1 gene, relapse remains a challenge, particularly in the advanced stages of the disease.

A notable feature of CML is the elevated number of basophils. For a long time, the high basophil count seen in CML was regarded as a mere byproduct of the disease rather than an active contributor. However, recent research has shifted this perspective. Basophilsplay a more significant role in the CML  progression than previously thought.

Indeed, in CML, basophils are not just passive markers but active participants in promoting cancer cell growth and spread. They release a variety of molecules, including inflammatory agents, angiogenic factors (which promote the formation of new blood vessels), and fibrogenic molecules (which contribute to tissue scarring). These substances, such as vascular endothelial growth factor (VEGF) and hepatocyte growth factor (HGF), help create an environment conducive to cancer cell survival and proliferation. Furthermore, basophils produce histamine and other vasoactive substances that aid in the spread of cancer cells beyond the bone marrow.

One particularly important enzyme that basophils release is CD26 (DPPIV). This enzyme breaks down a molecule that typically keeps stem cells anchored in the bone marrow. When CD26 degrades this molecule, it allows CML stem cells to mobilize and spread to other areas of the body, accelerating disease progression.

Given this emerging evidence, basophils are now viewed as active contributors to CML. Their involvement in disease progression underscores the importance of accurately measuring basophil levels, as they are not just prognostic markers but potential therapeutic targets. Advanced methods to quantify basophils—such as targeting specific basophil-related antigens like CD203c, tryptase, and BB1—could lead to more precise diagnoses and improved monitoring of disease progression.

Non-Genetic Factors Influencing Basophil Count

In addition to genetic factors, several non-genetic factors can influence basophil count:

  • Medications: Certain medications can affect basophil counts. Corticosteroids, commonly used to reduce inflammation, and some antihistamines, used to treat allergic reactions, can lower basophil levels. It’s important to inform your healthcare provider about any medications you’re taking, as they can influence your blood test results and overall interpretation.
  • Health Conditions: Chronic health conditions can significantly impact basophil levels. For example, autoimmune disorders often cause fluctuations in basophil counts due to ongoing inflammation. Similarly, endocrine disorders of the thyroid such as hypothyroidism or hyperthyroidism can also affect basophil levels.
  • Lifestyle Factors: While the effect of lifestyle on basophil counts might not be as direct as other factors, maintaining a healthy lifestyle can influence immune function. Factors such as diet, stress levels, and overall health contribute to your immune system’s efficiency, which can, in turn, affect basophil levels.
  • Acute Conditions: Temporary health conditions, such as acute infections or severe allergic reactions, can cause short-term changes in basophil counts. These variations are often transient and should be interpreted alongside other clinical findings to understand their full context.

What are simple lifestyle tips to keep my basophils healthy?

Maintaining healthy basophil levels involves adopting a few straightforward lifestyle practices. Here’s how you can support your basophils and overall immune health:

  • Boost Your Immune System with Key Nutrients: Adequate intake of vitamins and minerals is essential for optimal immune function, which includes keeping your basophils in good shape. Focus on consuming foods  rich in:

    • Vitamin C: Found in citrus fruits, strawberries, and bell peppers, vitamin C helps support immune function and can aid in maintaining healthy basophil levels.

    • Vitamin B6: Present in poultry, fish, and bananas, vitamin B6 is crucial for producing and regulating various immune cells, including basophils.

    • Vitamin E: An antioxidant found in nuts, seeds, and green leafy vegetables, vitamin E helps protect cells from oxidative damage and supports immune health.

    • Zinc: This mineral, present in meats, shellfish, and legumes, plays a vital role in maintaining a healthy immune system and influencing basophil function.

  • Avoid Allergens: Since basophils are involved in allergic responses, minimizing exposure to known allergens can help prevent unnecessary activation of these cells. Identify and avoid substances that trigger your allergies to help maintain a balanced basophil count.

  • Eat a Well-Balanced Diet: A diet rich in fruits, vegetables, whole grains, and lean proteins supports overall health and immune function. Nutrient-dense foods  provide the essential vitamins and minerals that your body needs to keep immune cells, including basophils, functioning optimally.

  • Minimize Stress: Chronic stress can affect your immune system and potentially influence basophil levels. Incorporating stress-reducing practices such as regular exercise, meditation, and adequate sleep can help support overall immune health and stability in basophil counts.

Summary

Understanding The Genetics Behind Earlobe Structure

Genetics Behind Earlobe Structure

Disclaimer: This article is for informational purposes only and is not intended to diagnose any conditions. LifeDNA does not provide diagnostic services for any conditions mentioned in this or any other article.

Overview

While earlobes might seem similar to everyone at first glance, they vary in shape due to genetic differences. The earlobes or the bottom tip of your outer ear doesn’t contain cartilage which makes it firm, yet flexible connective tissue that supports body structures. Instead, it is made up of fleshy tissue called areolar connective tissue that makes up the earlobe making them soft and flexible. This type of tissue is made of nerves and blood vessels, which is why they can be easily pierced and heal quickly.

The functional role of earlobes in hearing remains unclear, but they are believed to be mainly composed of extra tissue that helps form the structure of the ear. They contain blood vessels, which might help regulate ear temperature and keep them warm. This biological aspect, combined with its distinct shapes, highlights how earlobe types are deeply rooted in genetics. Understanding how these traits are inherited offers fascinating insights into our genetic makeup and the complex relationship of inherited traits.

You May Also Like: Can Age-related Hearing Loss Be Genetic?

Genetic Influences on Earlobe Structure

What are the Earlobe Types?

The human earlobes may appear to be attached, partially attached, or free from the sides behind the face. Research indicates an average size of 1.88 cm in height and 1.96 cm in width, with the potential for ongoing growth throughout life, linked to factors such as aging, stretching, and sagging. Contributing to elongated earlobes over time are increased facial fat, collagen depletion, and mechanical stress from activities like wearing heavy earrings that affect tissue elasticity and strength.

Free Earlobes

Characterized by their larger size and the way they hang down from the point of attachment to the head and are not directly connected along their length, free earlobes result from the influence of a dominant allele and are the most common type of earlobes found.

When one or both parents carry this dominant allele, their children are likely to inherit free earlobes. However, it is important to note that even if both parents have free earlobes, their children still can have attached earlobes if both parents carry a recessive allele. This explains the genetic combination that occurs among dominant and recessive alleles, which demonstrates the complex interplay of genetics.

Attached Earlobes

They are smaller in size and connect directly to the side of the head without hanging freely. This type of earlobe is the result of the recessive allele being expressed in the absence of the dominant allele. Therefore, for a person to have attached earlobes, they must inherit the recessive allele from both parents. Interestingly, parents with attached earlobes do not always produce children with attached earlobes; the genetic outcome depends on the combination of alleles present in the parents.

Why Do Earlobes Differ in Size and Shape?

Earlobes exhibit a wide range of sizes, shapes, and thicknesses with encompassing forms like arched, tongue-shaped, square, and triangular. The shape and size of earlobes are primarily influenced by genetics, with specific alleles determining whether earlobes are free or attached. However, other factors such as sex, age, and ethnic background also contribute to earlobe variations. 

A study by Pradhuman Verma categorized ear shapes and earlobe attachment types among 80 randomly selected students in India, revealing that 35% had free earlobes, while 65% had attached earlobes. Oval was found to be the most common ear shape in both populations studied. The authors emphasized that ear characteristics, being hereditary and unique to each individual, may serve as reliable markers for personal identification.

This study adds to existing knowledge by focusing on how genetic and ethnic factors shape ear characteristics. For instance, a separate analysis of earlobe length in a study that included 547 subjects found significant variations based on sex, age, and ethnic origin. Women generally exhibited symmetrical earlobes measuring around 1.97 cm on the left and 2.01 cm on the right, while men showed less symmetry, particularly in non-pierced earlobes.

Ethnicity also played a role, with specific populations like Ashkenazi and Sephardic Jews having longer left earlobes compared to Ethiopian, Asian, American Jews, and Arabs. There are also differences based on skin tone where Black individuals generally have shorter earlobes than people with darker or fairer skin tones. These findings show how both genetics and environmental factors affect earlobe characteristics, giving us a better understanding of human diversity in physical traits.

Can Genetic Disorders Affect the Structure of the Earlobe?

In rare cases, genetic disorders may lead to distinct abnormalities in earlobe shape, providing insights into the complex genetic factors influencing physical characteristics. Here are some: 

  1. Inherited Speech Disorders and Earlobe Shape: Some disorders may cause earlobes to appear larger than usual relative to head size, often with a thickened, lumpy center. These features are often linked with inherited speech disorders, highlighting the relationship between genetic and physical traits.

  2. Wolf-Hirschhorn Syndrome: Resulting from a deletion on chromosome 4, this syndrome presents with a range of developmental challenges. Children affected may have abnormal skull shapes, poor growth, and notably shaped earlobes, which vary significantly in size and form due to genetic abnormalities.

  3. Beckwith-Wiedemann Syndrome: Characterized by overgrowth affecting multiple organ systems, including the abdomen and major organs. Individuals with this syndrome may have deep red birthmarks on their faces and earlobes with deep creases or splits.

Impact of Earlobe Types and Shapes on Health 

While earlobe types are generally benign genetic traits, certain shapes may be associated with specific genetic conditions. For instance, attached earlobes have been observed in some genetic disorders. However, for most people, earlobe shape has no significant health impact and remains a unique aspect of their genetic identity.

Earlobes Associated Conditions 

Earlobes, while often seen as a facial feature, may be at risk for a range of conditions and issues:

Allergic Contact Dermatitis: Earlobes may develop inflamed and itchy skin rashes when exposed to allergens, commonly triggered by nickel-containing earrings. Nickel allergies affect over 18% of individuals in North America.

Infected Ear Piercing: Improperly cleaned or cared for earlobe piercings may become infected, presenting symptoms such as redness, swelling, heat, and pus drainage.

Split Earlobe: Earlobes may tear into two pieces due to injury or from prolonged use of heavy earrings or large-gauge piercings. Partial splits may also develop over time.

Sebaceous Cysts: These can be painful and are commonly linked to overactive oil glands and excessive production of skin cells. It’s formed by the buildup of dead skin cells and oils on the front or back of the earlobe.

Cellulitis: Injuries or cuts to the earlobe increase the likelihood of developing this type of bacterial infection that impacts the deeper skin layers, resulting in redness, swelling, and discomfort in the earlobe

Infections in the earlobe resulting from piercings, insect bites, or other injuries are typically treated with antibiotics as advised by your primary care provider. In more severe cases, such as an abscess forming around an infected piercing, they may refer you to a specialist such as a dermatologist or ENT (ear, nose, and throat) doctor for further assessment and treatment of infections, cysts, or injuries. These conditions highlight the importance of proper care and attention to earlobe health, especially for individuals with pierced ears or those prone to skin allergies and infections.

Can You Change Your Earlobe Structure? 

Surgical Options

For individuals seeking to alter the structure and appearance of their earlobes, surgical options are available. Procedures can range from simple lobe reductions to more complex reconstructions, depending on the desired outcome. It’s crucial to thoroughly understand the risks and benefits associated with these interventions.

Ear Reshaping: Ear reshaping, or otoplasty, is a type of cosmetic surgery that modifies the size, shape, or position of the ears to improve facial symmetry and proportion. Typically performed through incisions behind the ear, this procedure sculpts the ear cartilage to achieve the desired aesthetic. It’s a safe procedure overall, although there are potential risks like infection or blood clots. Still, these are rare. During recovery, patients wear a head dressing initially and gradually resume normal activities under their surgeon’s guidance to ensure proper healing and optimal results.

Ear Reconstruction Surgery: Focuses on repairing or rebuilding the outer part of the ear or auricle/pinna. This surgery is often necessary for congenital defects present at birth (microtia repair)

 or to restore ears damaged by trauma such as burns or cancer surgeries (ear defect repair). Surgeons use various methods including rib cartilage grafts or medical implants to redesign or create a new ear structure. In some cases, a prosthetic outer ear anchored in bone may be considered as an alternative. 

Summary

  • Earlobes vary due to genetics, determining if they’re free, attached, or partially attached.
  • Earlobes lack cartilage, being flexible with nerves and blood vessels.
  • Free earlobes hang down and are not attached along their length, commonly influenced by dominant alleles.
  • Attached earlobes are smaller and directly connected to the side of the head, resulting from recessive alleles.
  • Genetic inheritance dictates earlobe type, with dominant alleles often leading to free earlobes.
  • Aging, heavy earrings, and facial fat affect earlobe size and shape.
  • Conditions like allergic dermatitis or infections may affect earlobes.
  • Auricular reconstruction repairs congenital defects or trauma using cartilage grafts.
  • Earlobes are believed to help regulate ear temperature through blood circulation.
  • Shapes like arched or triangular reflect genetic and developmental variations.
  • Earlobe traits may help in personal identification in forensics.
  • Earlobes vary in shape due to genetic differences, and they are made of soft, flexible areolar connective tissue without cartilage.
  • The exact functional role of earlobes in hearing is unclear, but they may help  contribute to ear structure.
  • Earlobe characteristics are deeply influenced by genetics, offering insights into inherited traits and our genetic makeup.
  • Ear shaping or Otoplasty is a cosmetic surgery that alters the size, shape, or position of the ears to enhance facial symmetry and proportion.
  • Ear reconstruction surgery repairs or rebuilds the outer ear using grafts or prosthetics for congenital defects or trauma.
  • Some genetic disorders can make earlobes larger and lumpier.
  • Wolf-Hirschhorn Syndrome may cause abnormally shaped earlobes.
  • Beckwith-Wiedemann Syndrome may result in deep creases or splits in the earlobes.

References

  1. https://www.exploratorium.edu/snacks/ear-sort
  2. https://www.earhelp.co.uk/genes-shape-ear-lobes.html
  3. https://www.thetech.org/ask-a-geneticist/articles/2022/mendelian-earlobe-myth/
  4. https://pubmed.ncbi.nlm.nih.gov/12794488/
  5. https://www.ncbi.nlm.nih.gov/pmc/articles/PMC4948525/
  6. https://udel.edu/~mcdonald/mythearlobe.html
  7. https://pubmed.ncbi.nlm.nih.gov/6875152/
  8. https://learn.genetics.utah.edu/content/basics/observable/
  9. https://www.news-medical.net/health/Genetics-of-Earlobes.aspx
  10. https://www.health.com/earlobe-8424335
  11. https://www.ucsfhealth.org/treatments/ear-reshaping
  12. https://medlineplus.gov/genetics/condition/wolf-hirschhorn-syndrome/#:~:text=Some%20people%20with%20Wolf%2DHirschhorn,are%20characteristic%20of%20this%20disorder.
  13. https://www.mayoclinic.org/tests-procedures/ear-reconstruction/about/pac-20537188